Hi fellow Excel professionals,
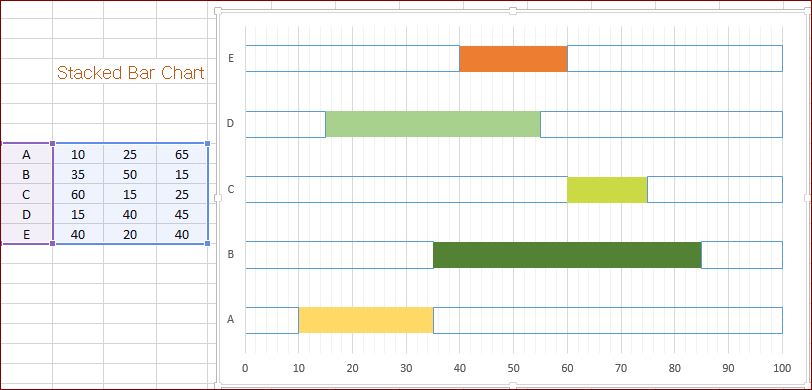
I searched the Web and the forum, but didn't find the solution for a problem very similar to one regularly and recently discussed. I have to draw dynamic bar chart colored red, amber, or green depending on whether the value crossed the limit. That is an easy part. I also need to show the range itself as a bar (I tried to put transparent grey bar over the first one, but without much success). Is this possible at all? The problem with the range is that it doesn't start from 0. All values are within 0-100. No need to have any labels, but I tried to show gridlines, and if I put white box to remove lower part of the range bar, gridlines there are removed, too. It is a kind of box plot but a bit different.
Any ideas? MS Excel 2016 Win/Mac - if there is a possibility to do this in VBA, just let me know! Appreciate any advice!
Kindest regards,
Paolo