Good Afternoon
I need help to work out how to show the proportion of days taken per category. I have posted how this looks in Excel however I am struggling to create a Measure in Power BI to replicate it.
My data is in one large table, called Sheet 1!
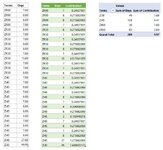
The example below: first 2 columns are actual (dummy) data which is SUM totalled and Averaged at the bottom. The third/forth column is how it would be calculated on a line by line basis.
The right hand columns shows how it would roll up on a Terms basis - so Z130 contributed 1.69 days to the overall average of 9.97
I wasn't sure whether to create the row level Contribution as a Calculated field first, then use a measure to summarise or if that would slow the model down (its C145k rows)
Any help and guidance would be appreciated.
I need help to work out how to show the proportion of days taken per category. I have posted how this looks in Excel however I am struggling to create a Measure in Power BI to replicate it.
My data is in one large table, called Sheet 1!
The example below: first 2 columns are actual (dummy) data which is SUM totalled and Averaged at the bottom. The third/forth column is how it would be calculated on a line by line basis.
The right hand columns shows how it would roll up on a Terms basis - so Z130 contributed 1.69 days to the overall average of 9.97
I wasn't sure whether to create the row level Contribution as a Calculated field first, then use a measure to summarise or if that would slow the model down (its C145k rows)
Any help and guidance would be appreciated.
| Terms | Days | Contribution | Formula | Terms | Days | Contribution | |
| ZR00 | 7 | 0.24138 | A2/$A$31*$A$32 | ZR00 | 30 | 1.03 | |
| ZR00 | 8 | 0.27586 | ZR30 | 82 | 2.83 | ||
| ZR00 | 8 | 0.27586 | ZI45 | 128 | 4.41 | ||
| ZR00 | 7 | 0.24138 | ZI30 | 49 | 1.69 | ||
| ZR30 | 8 | 0.27586 | 289.00 | 9.97 | |||
| ZR30 | 7 | 0.24138 | |||||
| ZR30 | 7 | 0.24138 | |||||
| ZR30 | 8 | 0.27586 | |||||
| ZR30 | 8 | 0.27586 | |||||
| ZR30 | 7 | 0.24138 | |||||
| ZR30 | 15 | 0.51724 | |||||
| ZR30 | 7 | 0.24138 | |||||
| ZR30 | 7 | 0.24138 | |||||
| ZR30 | 8 | 0.27586 | |||||
| ZI45 | 7 | 0.24138 | |||||
| ZI45 | 7 | 0.24138 | |||||
| ZI45 | 8 | 0.27586 | |||||
| ZI45 | 7 | 0.24138 | |||||
| ZI45 | 8 | 0.27586 | |||||
| ZI45 | 7 | 0.24138 | |||||
| ZI45 | 6 | 0.20690 | |||||
| ZI45 | 8 | 0.27586 | |||||
| ZI45 | 3 | 0.10345 | |||||
| ZI45 | 7 | 0.24138 | |||||
| ZI45 | 8 | 0.27586 | |||||
| ZI45 | 7 | 0.24138 | |||||
| ZI45 | 8 | 0.27586 | |||||
| ZI45 | 37 | 1.27586 | |||||
| ZI30 | 49 | 1.68966 | |||||
| Total | 289 | 9.97 | |||||
| Average | 9.97 | ||||||