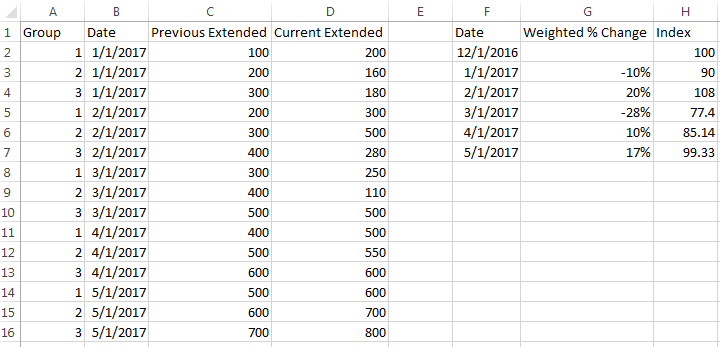
[FONT="]I am fairly new to PowerBI and am working to complete the following goal. I have a large data set in the form of columns A
 and I would like to have a measure which calculates column H, which I could filter and graph on my report. [/FONT]
[FONT="]
 [/FONT]
[FONT="] [/FONT]
[FONT="]While playing around with PowerBI I was able to create this roughly (in a way that doesn't work with filters on the report), in 3 main steps. [/FONT]
[FONT="] [/FONT]
[FONT="]1) Weighted % Change Measure from raw data (In forms of columns A
)[/FONT]
[FONT="] [/FONT]
[FONT="]2) Creating a intermediate calculated table with unique date values and the related weighted monthly % change[/FONT]
[FONT="]and the calculated column : [/FONT]
[FONT="] [/FONT]
[FONT="]3) I then used a calculated column to create the Index: (Luckily how my data is formulated, the Dec-16 is included in the unique values when making the intermediate table, and returns with a blank entry in the weighted measure field.[/FONT]
[FONT="]This compounds the growth from the base of 100 for each month and comes out with the correct answer.[/FONT]
[FONT="] [/FONT]
[FONT="]However, this calculated column (and I believe the use of the intermediate table entirely), does not allow report filters to affect this. So when I have 2 separate graphs on my report, one the WeightedMeasure over time, and one the Index over time. The WeightedMeasure reacts to report filters, however the Index does not.[/FONT]
[FONT="] [/FONT]
[FONT="]How can I get the index as a measure which reacts to the filters?[/FONT]
[FONT="]
[FONT="] [/FONT]
[FONT="]While playing around with PowerBI I was able to create this roughly (in a way that doesn't work with filters on the report), in 3 main steps. [/FONT]
[FONT="] [/FONT]
[FONT="]1) Weighted % Change Measure from raw data (In forms of columns A
[FONT="] [/FONT]
Code:
WeightedMeasure = (Sum(CurrentExtended)-Sum(PastExtended))/Sum(PastE<wbr style="box-sizing: inherit;">xtended)
Code:
Intermediate = distinct(Table1[Dates])
Code:
WeightedChange = Calculate([WeightedMeasure])[FONT="]3) I then used a calculated column to create the Index: (Luckily how my data is formulated, the Dec-16 is included in the unique values when making the intermediate table, and returns with a blank entry in the weighted measure field.[/FONT]
Code:
Index = 100 * PRODUCTX ( filter (Intermediate, Intermediate[Dates] <= earlier(Intermediate[Dates])), Test[POS] + 1)[FONT="] [/FONT]
[FONT="]However, this calculated column (and I believe the use of the intermediate table entirely), does not allow report filters to affect this. So when I have 2 separate graphs on my report, one the WeightedMeasure over time, and one the Index over time. The WeightedMeasure reacts to report filters, however the Index does not.[/FONT]
[FONT="] [/FONT]
[FONT="]How can I get the index as a measure which reacts to the filters?[/FONT]


