basednvirtus
New Member
- Joined
- Dec 24, 2021
- Messages
- 1
- Office Version
- 2016
- Platform
- MacOS
Hi,
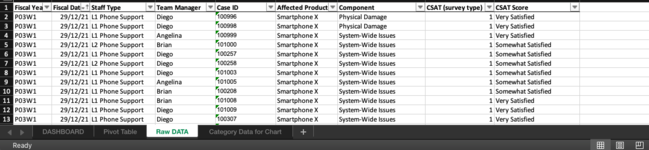
I need some help with a spreadsheet that I cannot change the source data (raw data), which is extracted from a report.
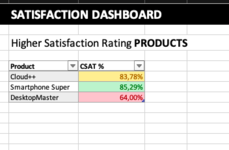
Basically, I need to identify the products with highest satisfaction rating among a plethora of products, in a single column with data that goes from smartphones, tablets, computers, smart keyboards, all the way to cloud services and accounts.
1. So, how to obtain the top 3 products with highest satisfaction rate? Is there a way to do it using pivot table (preferably with slicers) in an automated fashion?
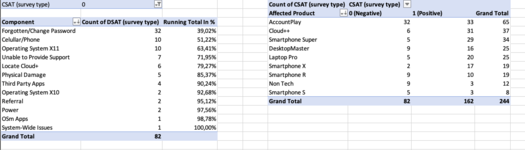
2. What would be the best way to sort it out the top 3 products without using filters? Besides the ‘affected product’ column, there’s another column with ‘0’ for dissatisfied rating and ‘1’ for satisfied rating. Which I tend to use as way to calculate the satisfaction % (positive surveys ÷ total surveys).
I was thinking of displaying the data with a simple table with INDEX(MATCH, or to sort it with SUMPRODUCT as conditional ranking (couldn’t do it), or even categorize the products and make a column bar graph out of it, but I’m really lost on this one.
Ps: I wasn't able to figure it out how to post the spreadsheet here
The Sample Data: Example - SampleData - Download - 4shared - Willian Sacramento
Also asked here Rank top 3 Products with highest satisfaction rating
I need some help with a spreadsheet that I cannot change the source data (raw data), which is extracted from a report.
Basically, I need to identify the products with highest satisfaction rating among a plethora of products, in a single column with data that goes from smartphones, tablets, computers, smart keyboards, all the way to cloud services and accounts.
1. So, how to obtain the top 3 products with highest satisfaction rate? Is there a way to do it using pivot table (preferably with slicers) in an automated fashion?
2. What would be the best way to sort it out the top 3 products without using filters? Besides the ‘affected product’ column, there’s another column with ‘0’ for dissatisfied rating and ‘1’ for satisfied rating. Which I tend to use as way to calculate the satisfaction % (positive surveys ÷ total surveys).
I was thinking of displaying the data with a simple table with INDEX(MATCH, or to sort it with SUMPRODUCT as conditional ranking (couldn’t do it), or even categorize the products and make a column bar graph out of it, but I’m really lost on this one.
Ps: I wasn't able to figure it out how to post the spreadsheet here
The Sample Data: Example - SampleData - Download - 4shared - Willian Sacramento
Also asked here Rank top 3 Products with highest satisfaction rating
Attachments
Last edited by a moderator:


