thatoneguy650
Board Regular
- Joined
- Jan 17, 2014
- Messages
- 103
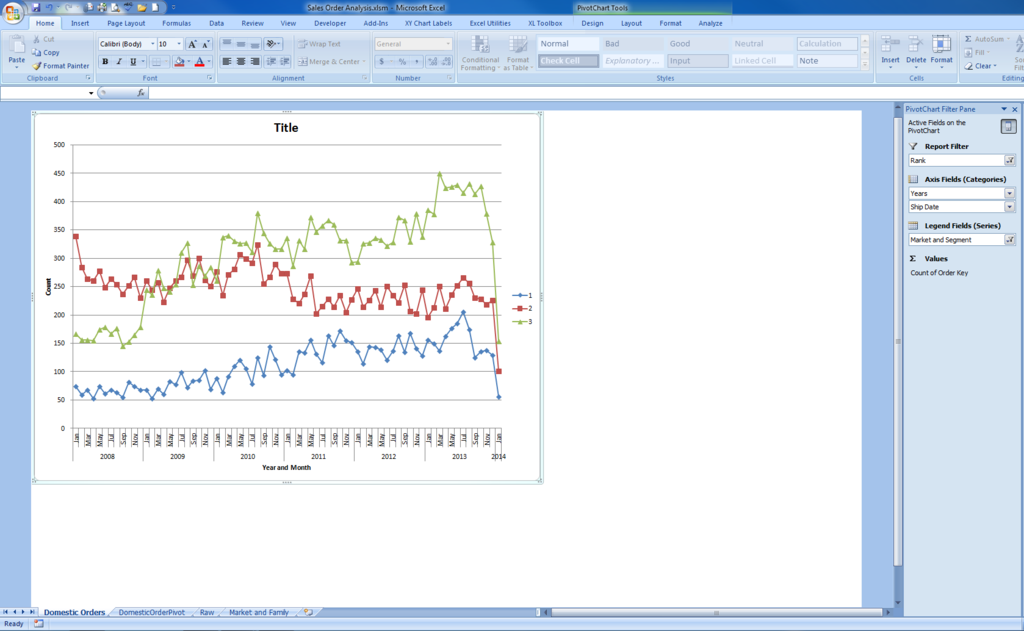
I am trying to re-size a chart that is in its own chart sheet, but none of the regular chart re-sizing methods are working. What my code does so far is make a pivot then use that pivot to make a chart, take the chart and move it to a new chart sheet. It then re-sizes it for 11x17 paper and finally it should make the chart fill up the 11x17 page.
This is what I have now:
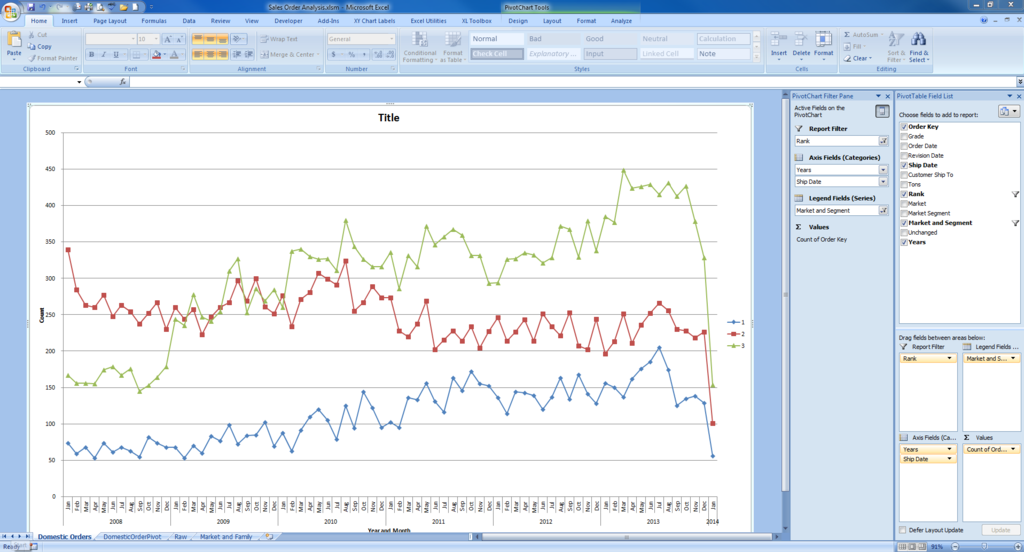
This is what I want
My code is as follows:
This is what I have now:
This is what I want
My code is as follows:
Code:
Sub domesticOrderPivot()

Sheets("Raw").Activate
Columns("A:L").Select


Sheets.Add.Name = "DomesticOrderPivot"
ActiveWorkbook.PivotCaches.Create(SourceType:=xlDatabase, SourceData:= _
    "Raw!R1C1:R1048576C12", Version:=xlPivotTableVersion12).CreatePivotTable _
    TableDestination:="DomesticOrderPivot!R3C1", TableName:="PivotTable1", DefaultVersion _
    :=xlPivotTableVersion12
Sheets("DomesticOrderPivot").Select
Cells(3, 1).Select
ActiveSheet.PivotTables("PivotTable1").AddDataField ActiveSheet.PivotTables( _
    "PivotTable1").PivotFields("Order Key"), "Count of Order Key", xlCount
With ActiveSheet.PivotTables("PivotTable1").PivotFields("Rank")
    .Orientation = xlPageField
    .Position = 1
End With
ActiveSheet.PivotTables("PivotTable1").PivotFields("Rank").ClearAllFilters
ActiveSheet.PivotTables("PivotTable1").PivotFields("Rank").CurrentPage = "1"
With ActiveSheet.PivotTables("PivotTable1").PivotFields("Market and Segment")
    .Orientation = xlColumnField
    .Position = 1
End With
With ActiveSheet.PivotTables("PivotTable1").PivotFields("Ship Date")
    .Orientation = xlRowField
    .Position = 1
End With
Range("A14").Select
Selection.Group Start:=True, End:=True, Periods:=Array(False, False, False, _
    False, True, False, True)
ActiveWindow.SmallScroll Down:=-24
With ActiveSheet.PivotTables("PivotTable1").PivotFields("Market and Segment")
    .PivotItems("Domestic - ").Visible = False
    .PivotItems("Domestic - Non-Prime").Visible = False
    .PivotItems("Domestic - Publication").Visible = False
    .PivotItems("Export").Visible = False
    .PivotItems("NJA").Visible = False
    .PivotItems("NPI").Visible = False
    .PivotItems("(blank)").Visible = False
End With


ActiveSheet.Shapes.AddChart.Select
ActiveChart.SetSourceData Source:=Range("'DomesticOrderPivot'!$A$3:$E$85")
ActiveChart.ChartType = xlLineMarkers
ActiveChart.Location Where:=xlLocationAsNewSheet, Name:="Domestic Orders"
Sheets("Domestic Orders").PageSetup.PaperSize = xlPaper11x17
Sheets("Domestic Orders").Activate
ActiveChart.SetElement (msoElementChartTitleAboveChart)
ActiveChart.SetElement (msoElementPrimaryCategoryAxisTitleAdjacentToAxis)
ActiveChart.SetElement (msoElementPrimaryValueAxisTitleRotated)
ActiveChart.Axes(xlCategory).AxisTitle.Select
ActiveChart.Axes(xlCategory, xlPrimary).AxisTitle.Text = "Year and Month"
ActiveChart.Axes(xlValue).AxisTitle.Select
ActiveChart.Axes(xlValue, xlPrimary).AxisTitle.Text = "Count of Orders"
ActiveChart.ChartTitle.Select
ActiveChart.ChartTitle.Text = "Count of Domestic Orders from 2008"
Sheets("Domestic Orders").ChartObjects(1).Select
     With ActiveChart.Parent
         .Height = 3250 ' resize
         .Width = 5000  ' resize
         .Top = 100    ' reposition
         .Left = 100   ' reposition
     End With
End Sub


