Return Filter Names of current Filter Context

ImkeF

Well-known Member
Joined
Feb 1, 2015
Messages
544
Is there a way to return the filter name(s) of the current filter context in a DAX-measure?

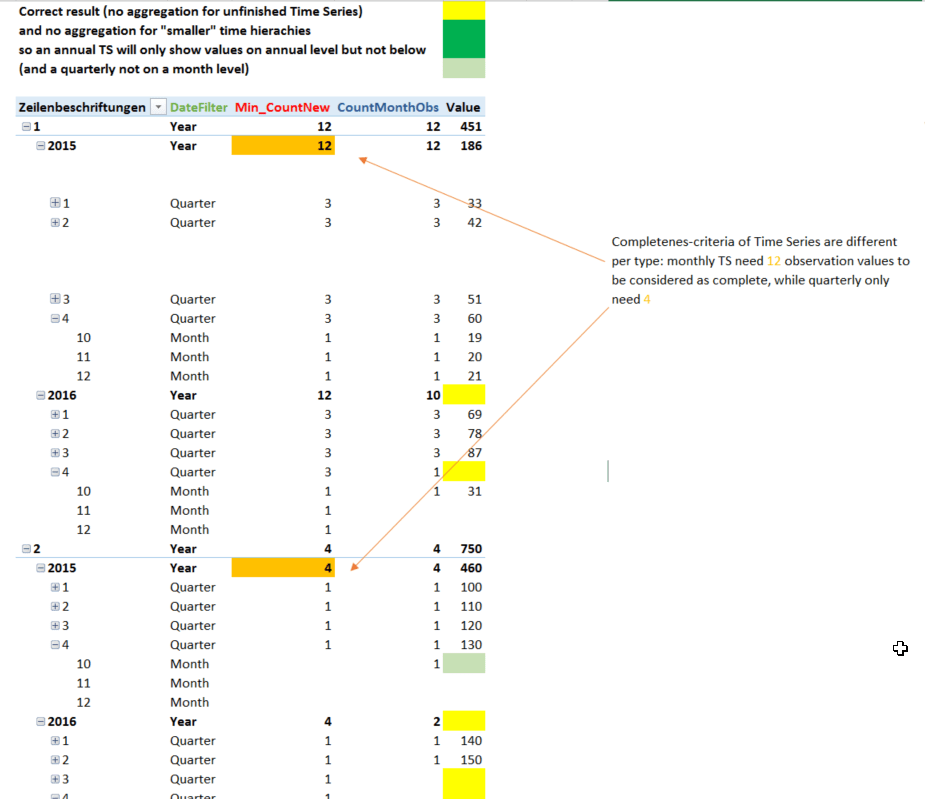
Background: Want to calculate aggregates on time series only if they are complete. I.e. if it is a monthly time series with values from Jan 2014-Aug 2015, then the aggregations for 2014 will all be shown: annual, as well as all 4 quarters. But for 2015 only the first 2 quarters aggregations shall be shown (no unfinished quarters and year).

So I need to check which filter context applies in the current cell (annual or quarter) in order to determine the necessary conditions (for an annual aggregations of monthly time series there must be 12 values reported already, whereas for a quarterly aggregation I need only 3 monthly values (..and for a quarterly time series only 4 reported values are necessary for the annual aggregation).

So the measure needs to detect the current filter context (quarter or year) in order to return the minimum-number of reported periods. This will then be compared against the actual number of reported periods and if they match, the aggregation will be shown.
So my current approach is to count the number of months in the calender and determine the selections based on that (if 12, then year, if 3, then quarter...) but as this is on very large tables, I'm looking for performance improvements.

If there is a better solution than this approach – please tell!
 
Last edited:

Excel Facts

Can you sort left to right?
To sort left-to-right, use the Sort dialog box. Click Options. Choose "Sort left to right"
Hi Imke

what is the use case? exactly how will the user provide time based input for your report? When you say the measure needs to detect quarter or annual, what does that mean? Normally I would expect a single measure eg sum(table[sales]) and then the calendar table columns (eg Qtr or Year) determine the aggregation level.

One way that may work for you is to hard code measures as follows

Full Qtr Sales:=if(countrows(values(Calendar[Month]))=3,sum(data[sales]))
Full Year Sales:=if(countrows(values(Calendar[Month]))=12,sum(data[sales]))

These should only be used when you have the matching granularity in your reports of course.

Does that help/work?
 
Upvote 0
Hi Matt,
thanks a lot for having a look into this.

This is an analysis on statistical observations. These time series are either: monthly, quarterly or annually and all sit in one very big table (FactObervations: 500k different series with an average of 600 rows per TS!). Theres 1 dimension table, holding all the metadata, incl. the column TimeSeriesFrequency which gives the frequency.

The number of observations needed for a time series to be considered as complete differs from the frequency: For the annual aggregations 12 months would be needed on monthly TS (this is where your Formula would work), but for the quarterly TS, only 4 observations would be needed for the annual aggregtion (which is where the formula fails at the moment).

So I have to lookup the matching month count in from the DIM-table dynamically (according to the current filter context that is delivered by the measure in question [DateFilter]). Currently using this measure:
Min_CountNew:=SWITCH([DateFilter];"Year";MAX(DimTimeSeries2[MinCountYear]);"Quarter";MAX(DimTimeSeries2[MinCountQtr]);MAX(DimTimeSeries2[MinCountMonth]))
(but will check Marco Russos alternative for SWITCH on this).

It might be easier to understand if you have a look at the workbook (Sheet: "Description": https://www.dropbox.com/s/4136z6xsw26i9pi/ShowOnlyCompleteData1.xlsx?dl=0

This is a bit unusual - googled quite a lot but couldn't find examples on time series analysis with Power Pivot or Tabular. But as the tables are really long, every step that doesn't have to be calculated might help performance.
 
Upvote 0
, but for the quarterly TS, only 4 observations would be needed for the annual aggregtion (which is where the formula fails at the moment).

I'm confused with this. Are you saying your data contains results at differing granularity? Normally I would expect to have the source data at a common granularity - ie monthly. Then quarters = 3x months, years = 12 X months. Then let the calendar table roll up the months as needed automatically.

If you do have quarters stored and months stored, why? Don't the quarters add up to e same results as the months?

Maybe be I am missing something.

I am also confused by your use of the phrase "time series". Do you just mean monthly observations or something else?
 
Last edited:
Upvote 0
Sorry, I know I'm not the best explainer :(

Say we have monthly unemployment rates (average % during month), but only quarterly figures for the seasonally adjusted unemployment rate (because the amount of work that goes into the adjustment calculation, they only come out on a quarterly basis: average % during quarter).

Once there are 12 reports for the monthly rates (Jan-Dec), an annual rate shall be calculated (Average) (1). But for the seasonally adjusted we need only 4 values (Mar, Jun, Sep & Dec) to trigger the annual calculation (2).

So the amount of months that needs to be there before aggregations takes place is dependent on 2 criteria: The time series frequency (which sits in the DIM-table) and the Filter context (which comes from my measure):

ME_CalculateOnlyCompletedSeries.png


The blanks shall be blank:
ME_CalculateOnlyCompletedSeries2.png
 
Upvote 0
I'm confused with this. Are you saying your data contains results at differing granularity? Normally I would expect to have the source data at a common granularity - ie monthly. Then quarters = 3x months, years = 12 X months. Then let the calendar table roll up the months as needed automatically.

If you do have quarters stored and months stored, why? Don't the quarters add up to e same results as the months?

Maybe be I am missing something.

I am also confused by your use of the phrase "time series". Do you just mean monthly observations or something else?

They are mostly non-additive-figures more or less: %, Indizes - only sometimes figures that could as well being added (like GDP). Technically they are reported with day in the date-column of the fact-table. So if a quarterly figure is reported with 30.09.2015 it will mean that it belongs to the 3rd quarter (these relations come from the calendar table).

Hope the rest is explained by my previous post : -)
 
Last edited:
Upvote 0
I am missing something - I don't know what. If you can aggregate 12 monthly figures to make an annual figure, why do you need the quarterly pre-aggregated figures? Is this because the quarterly numbers are seasonally adjusted and the monthly are not?

I think the only way I can help from here is if you could share a desensitised workbook with enough data so I can see what you are doing.
 
Upvote 0
You're really busy here - resend link from 2nd post :)

Yes - it's helps to assume that none of the time series have any connection to each other. Aggregation across a single TimeSeriesID is forbidden is leads to wrong results.
That's completely different to normal accounting- or marketing scenarios where an aggregation over attributes will make sense and is desired.
The only aggregation that takes place in the model is aggregation across time within the same TimeSeries (Id).

The examples from my monthly unemployment rates and quarterly adjusted unemployment rates means that they are 2 completely different TS who have a different meaning and shouldn't be mixed or aggregated across/between each other.

They just have to be shown in the same report side by side - dynamically. Meaning: The report will be refreshed every week and then a new (aggregated) figure shall be shown once new data has been collected that fulfills the aggregation criteria.
 
Upvote 0
I'm on my way to work, then PUG and a bazillion other things in the next 24 hours, so there won't be much Mr Excel (except he is coming to the PUG and then I am taking him out to dinner). So not much I can do in the next 24 hours.

It is difficult to write DAX over a data model that you have never seen and can't conceptualise. It's like helping someone with a jigsaw without seeing the puzzle but only the single piece. "Where does this piece go?" Unless I can see where you are putting the pieces, I can't help.
 
Upvote 0

Forum statistics

Threads
1,214,385
Messages
6,119,209
Members
448,874
Latest member
b1step2far

We've detected that you are using an adblocker.

We have a great community of people providing Excel help here, but the hosting costs are enormous. You can help keep this site running by allowing ads on MrExcel.com.
Allow Ads at MrExcel

Which adblocker are you using?

Disable AdBlock

Follow these easy steps to disable AdBlock

1)Click on the icon in the browser’s toolbar.
2)Click on the icon in the browser’s toolbar.
2)Click on the "Pause on this site" option.
Go back

Disable AdBlock Plus

Follow these easy steps to disable AdBlock Plus

1)Click on the icon in the browser’s toolbar.
2)Click on the toggle to disable it for "mrexcel.com".
Go back

Disable uBlock Origin

Follow these easy steps to disable uBlock Origin

1)Click on the icon in the browser’s toolbar.
2)Click on the "Power" button.
3)Click on the "Refresh" button.
Go back

Disable uBlock

Follow these easy steps to disable uBlock

1)Click on the icon in the browser’s toolbar.
2)Click on the "Power" button.
3)Click on the "Refresh" button.
Go back
Back
Top