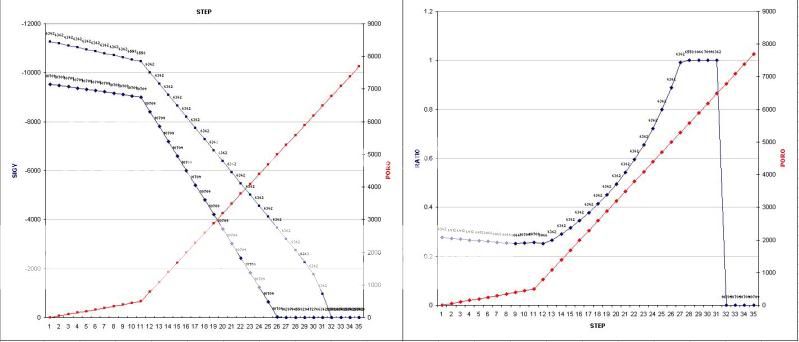
I'm creating a macro that creates a graph. However, the Y-value of one of the lines is always negative but approaching zero and the other is always positive and increasing, so I used ReversePlotOrder = True for the former. That way the graphs are easy to distinguish: one goes up, the other goes down.
However, I've hit a bump. ReversePlotOrder = True throws the Title of the X axis to the top of the graph.
Here's the code:
That's just a small part of the code, but it works.
So my question is, how can I move the X-axis Title back down?
However, I've hit a bump. ReversePlotOrder = True throws the Title of the X axis to the top of the graph.
Here's the code:
Code:
Sub Graph()
'Application.ScreenUpdating = True
Application.ScreenUpdating = False
With ActiveWorkbook.Worksheets(2)
    ActiveWorkbook.Worksheets(2).Activate
    Range("X2").End(xlDown).Activate
    Set LstCl = ActiveCell
    'SIGYxPORO
    Set Rng1 = Range("X2", LstCl)
    Set Rng2 = Range("AA2", Cells(LstCl.Row, LstCl.Column + 3))
    Set Rng3 = Range("Z2", Cells(LstCl.Row, LstCl.Column + 2))
    Set Rng4 = Range("AC2", Cells(LstCl.Row, LstCl.Column + 5))
    Set Rng = Union(Rng1, Rng2, Rng3, Rng4)
    Sname = Range("A1").Parent.Name
    Charts.Add
    ActiveChart.ChartType = xlColumnClustered
    ActiveChart.SetSourceData Source:=Rng, PlotBy:=xlColumns
    ActiveChart.Location Where:=xlLocationAsObject, Name:=Sname
    ActiveChart.HasTitle = False
    With ActiveChart
        .Axes(xlCategory, xlPrimary).HasTitle = True
        .Axes(xlCategory, xlPrimary).AxisTitle.Characters.Text = "STEP"
        .Axes(xlValue, xlPrimary).HasTitle = True
        .Axes(xlValue, xlPrimary).AxisTitle.Characters.Text = "SIGY"
        .Axes(xlValue).ReversePlotOrder = True
    End With
End With
Application.ScreenUpdating = True
End SubSo my question is, how can I move the X-axis Title back down?