In short I want to use multiple drop downs to display the risk percentage of selected data. I am new to Excel so I am not even sure if this is possible... please advise.
About the data: We rolled marbles in different obstacle courses going horizontal and vertical. We documented if the marble fell through a hole in the boxes - which would be "bad". Attached is a sample of data from the experiment. Our real lists can range from 1,000 to 10,000 rows.
All the bold columns are lists I want in the drop downs.
The first 3 digits of the ID indicate what obstacle course the marble was in 201, 202, or 203 which is why I calculated that in the 2nd column.
The 5th column tells if the marble ended in the same box.
What I'm looking for:
-Part 1: A chart where people can select different drop downs and have the chart display the risk percentage of the selected data.
For example
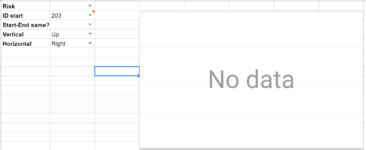
ID start 203
Start-End Same? Yes
Vertical Up
Horizontal Right
would display 100% because 100% of the time it ended Bad.
If the user left Start-End Same? blank I'd like for the chart to not filter anything for that field. The chart should display 75%.

-Part 2: I want to use drop downs to display the Risk - so riskiest recorded path, and the least risky path. That first drop down would auto-populate data for the following 4 fields and force a calculation in the chart.
For example: I want whoever uses this chart to know the combination listed in Part 1 (above) is the riskiest path... if they rolled the marble UP and RIGHT in the same box of obstacle 203, it would be 100% bad.
About the data: We rolled marbles in different obstacle courses going horizontal and vertical. We documented if the marble fell through a hole in the boxes - which would be "bad". Attached is a sample of data from the experiment. Our real lists can range from 1,000 to 10,000 rows.
All the bold columns are lists I want in the drop downs.
The first 3 digits of the ID indicate what obstacle course the marble was in 201, 202, or 203 which is why I calculated that in the 2nd column.
The 5th column tells if the marble ended in the same box.
| ID | ID start | Start Box | End Box | Start-End same? | Vertical | Horizontal | Fall? | Good/Bad |
| 201234 | 201 | abc | abc | TRUE | Up | Right | Y | Bad |
| 202345 | 202 | cde | cde | TRUE | Down | Left | Y | Bad |
| 203456 | 203 | def | cde | TRUE | Up | Right | Y | Bad |
| 202567 | 202 | ghi | def | FALSE | Down | Right | N | Good |
| 201678 | 201 | efg | efg | TRUE | Up | Left | N | Good |
| 203789 | 203 | fgh | fgh | TRUE | Down | Right | N | Good |
| 203900 | 203 | ghi | ghi | TRUE | Up | Right | Y | Bad |
| 201011 | 201 | hij | ghi | FALSE | Down | Right | N | Good |
| 202122 | 202 | ijk | hij | FALSE | Up | Left | N | Good |
| 201233 | 201 | jkl | ijk | FALSE | Down | Right | N | Good |
| 202344 | 202 | klm | klm | TRUE | Up | Right | Y | Bad |
| 203426 | 203 | lmn | lmn | TRUE | Up | Right | Y | Bad |
| 201568 | 201 | mno | lmn | FALSE | Down | Right | Y | Bad |
| 203665 | 203 | nop | mno | FALSE | Up | Right | N | Good |
What I'm looking for:
-Part 1: A chart where people can select different drop downs and have the chart display the risk percentage of the selected data.
For example
ID start 203
Start-End Same? Yes
Vertical Up
Horizontal Right
would display 100% because 100% of the time it ended Bad.
If the user left Start-End Same? blank I'd like for the chart to not filter anything for that field. The chart should display 75%.
-Part 2: I want to use drop downs to display the Risk - so riskiest recorded path, and the least risky path. That first drop down would auto-populate data for the following 4 fields and force a calculation in the chart.
For example: I want whoever uses this chart to know the combination listed in Part 1 (above) is the riskiest path... if they rolled the marble UP and RIGHT in the same box of obstacle 203, it would be 100% bad.