Eoughphily
New Member
- Joined
- Mar 1, 2020
- Messages
- 6
- Office Version
- 365
- Platform
- Windows
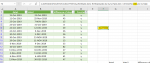
I'm trying to find the rolling last number of day average from a table of data with filtered cells. I originally had my formulas setup with raw data and not in a table format. The formulas worked beautifully until I changed it up and created tables from a master list of data for multiple types of queries. Once I did this I ran into hidden/filtered cells giving me inaccurate results. I have columns of dates and a column of numbers which are gathered from the difference between two dates. I'm looking for the average from the last any number of days. Here is the original formula I was using =AVERAGEIFS(C2:C21,A2:A21,">="&TODAY ()-90) where column C Has the data and column A has the dates. I believe I need to incorporate subtotal and offset into my formula to ignore hidden cells, but I can't seem to get it to work with the rolling average criteria. =SUBTOTAL (1, (IFS (A2:A21,C2:C21,">="&TODAY ()-90,OFFSET (H2:H21,0,-5)))) Is one of many variations i have tried but it just gives me the filtered average and night the rolling average. I know my columns are reversed on the second formula, when I put c first then a I get the average of dates which is a number the the thousands. I have spent all day searching Google to point me in the right direction but I cannot get it to work. Can somebody please assist? Thank you