Hello,
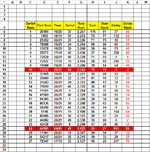
My data range C2:K32 i want to highlight 2 rows by finding min/max value of the column "K" and highlight entire row.
One formula to find Min value in the column ranges K2:K32 and highlights the entire row.
Second formula to find Max value in the column ranges K2:K32 and highlights the entire row.
For example, the sample image is attached.
Thank you all.
I am using Excel 2000
Regards,
Moti
My data range C2:K32 i want to highlight 2 rows by finding min/max value of the column "K" and highlight entire row.
One formula to find Min value in the column ranges K2:K32 and highlights the entire row.
Second formula to find Max value in the column ranges K2:K32 and highlights the entire row.
| * | A | B | C | D | E | F | G | H | I | J | K | L | M |
| 1 | |||||||||||||
| 2 | |||||||||||||
| 3 | |||||||||||||
| 4 | |||||||||||||
| 5 | Seriol Num | Part Num | Year | Seriol | Row Num | Sum | Sum Rank | Delay | Delay Rank | ||||
| 6 | 1 | 26184 | 19/20 | 37 | 2.267 | 176 | 81 | 77 | 50 | ||||
| 7 | 2 | 1905 | 18/19 | 51 | 2.212 | 72 | 77 | 132 | 61 | ||||
| 8 | 3 | 25452 | 20/21 | 37 | 2.326 | 71 | 75 | 18 | 17 | ||||
| 9 | 4 | 78688 | 19/20 | 34 | 2.264 | 99 | 80 | 80 | 51 | ||||
| 10 | 5 | 12678 | 19/20 | 39 | 2.269 | 39 | 66 | 75 | 49 | ||||
| 11 | 6 | 25777 | 17/18 | 42 | 2.136 | 27 | 50 | 208 | 69 | ||||
| 12 | 7 | 72839 | 20/21 | 50 | 2.339 | 71 | 75 | 5 | 6 | ||||
| 13 | 8 | 72427 | 17/18 | 10 | 2.104 | 38 | 65 | 240 | 72 | ||||
| 14 | 9 | 19998 | 19/20 | 50 | 2.280 | 29 | 54 | 64 | 45 | ||||
| 15 | 10 | 15418 | 20/21 | 54 | 2.343 | 79 | 78 | 1 | 2 | ||||
| 16 | 11 | 33165 | 19/20 | 21 | 2.251 | 35 | 60 | 93 | 53 | ||||
| 17 | 12 | 29449 | 20/21 | 22 | 2.311 | 41 | 70 | 33 | 30 | ||||
| 18 | 13 | 31643 | 20/21 | 24 | 2.313 | 48 | 72 | 31 | 28 | ||||
| 19 | 14 | 79859 | 20/21 | 46 | 2.335 | 26 | 47 | 9 | 10 | ||||
| 20 | 15 | 11651 | 20/21 | 5 | 2.294 | 21 | 37 | 50 | 39 | ||||
| 21 | 16 | 41969 | 20/21 | 40 | 2.329 | 35 | 60 | 15 | 14 | ||||
| 22 | 17 | 94305 | 20/21 | 1 | 2.290 | 20 | 34 | 54 | 41 | ||||
| 23 | 18 | 86136 | 19/20 | 58 | 2.288 | 24 | 43 | 56 | 42 | ||||
| 24 | 19 | 59290 | 20/21 | 47 | 2.336 | 65 | 74 | 8 | 9 | ||||
| 25 | 20 | 5118 | 18/19 | 19 | 2.180 | 26 | 47 | 164 | 64 | ||||
| 26 | 21 | 82866 | 20/21 | 34 | 2.323 | 30 | 57 | 21 | 20 | ||||
| 27 | 22 | 44082 | 20/21 | 49 | 2.338 | 35 | 60 | 6 | 7 | ||||
| 28 | 23 | 42728 | 20/21 | 9 | 2.298 | 17 | 28 | 46 | 37 | ||||
| 29 | 24 | 44191 | 04/05 | 41 | 1.433 | 15 | 21 | 911 | 81 | ||||
| 30 | 25 | 11561 | 20/21 | 18 | 2.307 | 29 | 54 | 37 | 32 | ||||
| 31 | 26 | 54217 | 20/21 | 26 | 2.315 | 19 | 32 | 29 | 27 | ||||
| 32 | 27 | 78547 | 17/18 | 33 | 2.127 | 16 | 25 | 217 | 70 | ||||
| 33 | |||||||||||||
| 34 |
For example, the sample image is attached.
Thank you all.
I am using Excel 2000
Regards,
Moti
")