Row wise calculation in power bi

DSP VARMA

New Member
Joined
Dec 27, 2016
Messages
9
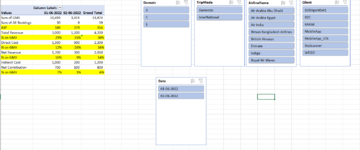
Hi All, I have attached a sample file with Raw Data and Summary sheets. In the Summary sheet, I have filled some cells with yellow color which I want in Power BI. I heard about the Averagex and Sumx formulae but I do not know how to you them. There might be some more slicers and conditions in the future. Can someone please help with the method on how to calculate in Power BI the yellow-filled cells in Power BI?

Tried to upload the excel file but was not able to upload it.

Also asked here Wanted row wise calculation in Power BI matrix Table
 

Attachments

  • 1654409143445.png
    1654409143445.png
    46 KB · Views: 12
Last edited by a moderator:

Excel Facts

VLOOKUP to Left?
Use =VLOOKUP(A2,CHOOSE({1,2},$Z$1:$Z$99,$Y$1:$Y$99),2,False) to lookup Y values to left of Z values.

Forum statistics

Threads
1,214,912
Messages
6,122,200
Members
449,072
Latest member
DW Draft

We've detected that you are using an adblocker.

We have a great community of people providing Excel help here, but the hosting costs are enormous. You can help keep this site running by allowing ads on MrExcel.com.
Allow Ads at MrExcel

Which adblocker are you using?

Disable AdBlock

Follow these easy steps to disable AdBlock

1)Click on the icon in the browser’s toolbar.
2)Click on the icon in the browser’s toolbar.
2)Click on the "Pause on this site" option.
Go back

Disable AdBlock Plus

Follow these easy steps to disable AdBlock Plus

1)Click on the icon in the browser’s toolbar.
2)Click on the toggle to disable it for "mrexcel.com".
Go back

Disable uBlock Origin

Follow these easy steps to disable uBlock Origin

1)Click on the icon in the browser’s toolbar.
2)Click on the "Power" button.
3)Click on the "Refresh" button.
Go back

Disable uBlock

Follow these easy steps to disable uBlock

1)Click on the icon in the browser’s toolbar.
2)Click on the "Power" button.
3)Click on the "Refresh" button.
Go back
Back
Top