rjbinney
Active Member
- Joined
- Dec 20, 2010
- Messages
- 279
- Office Version
- 365
- Platform
- Windows
I KNEW I shouldn't have slept through calculus!
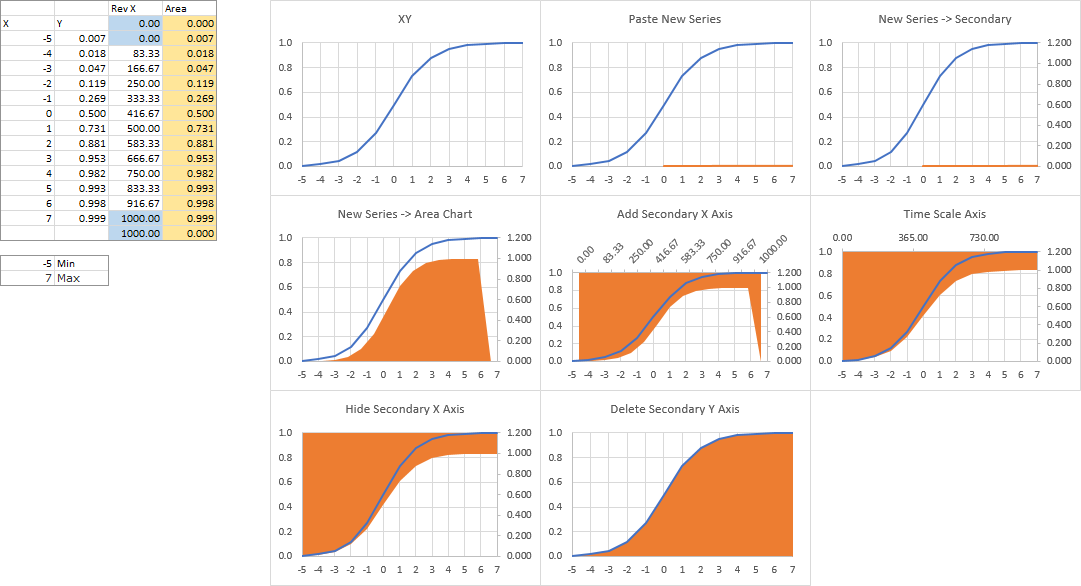
I would like a generic S-curve, but I'd like to color in under the curve. I have figured out how to color the entire area under the curve:
Excel 2016 (Windows) 32 bit
<tbody>
</tbody>
<tbody>
</tbody>
Where Column B=1/(1+EXP(-A))
Column C = 1000 * (A- MIN(A:A)) / (MAX(A:A)-MIN(A:A))
Which gives me:

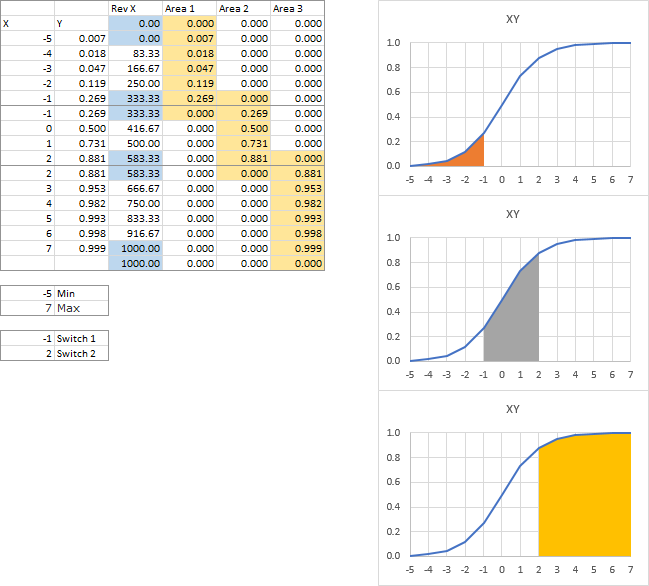
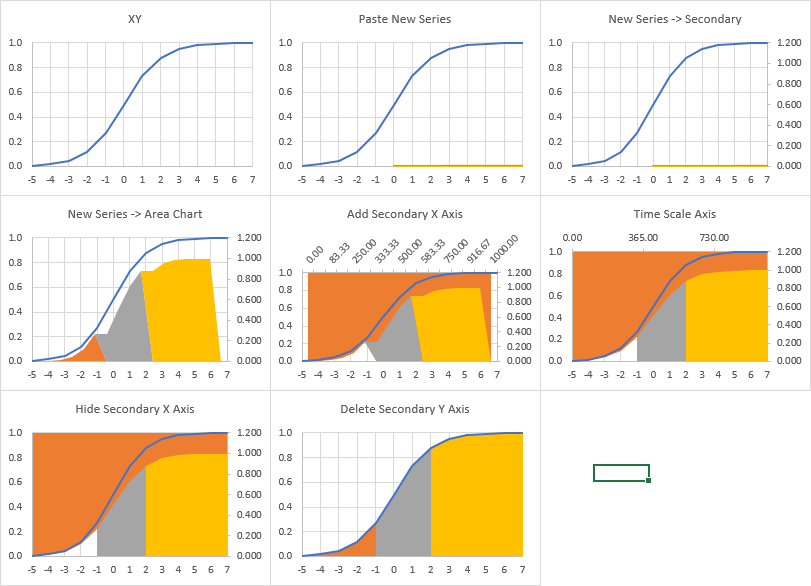
What I'd like to do is have multiple colors under the curve:

I would like a generic S-curve, but I'd like to color in under the curve. I have figured out how to color the entire area under the curve:
Excel 2016 (Windows) 32 bit
A | B | C | D | |
|---|---|---|---|---|
3 | Rev X | Area | ||
4 | X | Y | 0 | 0 |
5 | -5 | 0.006693 | 0 | 0.006693 |
6 | -4 | 0.017986 | 83.33333 | 0.017986 |
7 | -3 | 0.047426 | 166.6667 | 0.047426 |
8 | -2 | 0.119203 | 250 | 0.119203 |
9 | -1 | 0.268941 | 333.3333 | 0.268941 |
10 | 0 | 0.5 | 416.6667 | 0.5 |
11 | 1 | 0.731059 | 500 | 0.731059 |
12 | 2 | 0.880797 | 583.3333 | 0.880797 |
13 | 3 | 0.952574 | 666.6667 | 0.952574 |
14 | 4 | 0.982014 | 750 | 0.982014 |
15 | 5 | 0.993307 | 833.3333 | 0.993307 |
16 | 6 | 0.997527 | 916.6667 | 0.997527 |
17 | 7 | 0.999089 | 1000 | 0.999089 |
18 | ||||
19 | -5 | Min | ||
20 | 7 | Max |
<tbody>
</tbody>
| Sheet: Sheet1 |
<tbody>
</tbody>
Where Column B=1/(1+EXP(-A))
Column C = 1000 * (A- MIN(A:A)) / (MAX(A:A)-MIN(A:A))
Which gives me:
What I'd like to do is have multiple colors under the curve: