Show Overnight Data as Occuring on One Day

bjk896

New Member
Joined
Sep 8, 2022
Messages
8
Office Version
  1. 2007
Platform
  1. Windows
I have data from an outposted data logger that logs date and time of an occurrence eg 2021-09-28_19-15-07 for Date and hh-mm-ss. This data only occurs between 1700 and 0700 next day, so for one night’s effort I get Date 1 for occurrences to midnight and Date 2 for those post midnight.

2021-09-28_19-15-07 shows for 28/9/2021 and
2021-09-29_03-37-16 shows for 29/2/2021

I don’t care which day is used when it is all finally put on a scatter chart but it is more meaningful for this to be shown as 1 day.
I have no problem converting formats between time and date serial and numbers

How do I do it ?

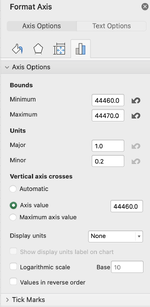
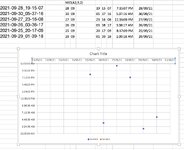
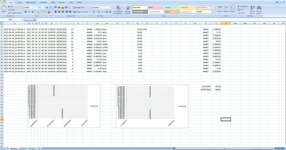
I then make a scatter chart using date serials as numbers and decimal times (with X = Date, Y = Time) How can I eliminate the redundant times between 0700 and 1700 in the Time axis?

bjk
 

Excel Facts

Create a Pivot Table on a Map
If your data has zip codes, postal codes, or city names, select the data and use Insert, 3D Map. (Found to right of chart icons).
Hello there, how many occurrences will you have for one day i.e. between 1700 and 0700? like you have two logs in your example.

Is this what you are looking for as in image
 

Attachments

  • Screenshot 2022-09-11 at 7.37.44 AM.png
    Screenshot 2022-09-11 at 7.37.44 AM.png
    97.7 KB · Views: 14
  • Screenshot 2022-09-11 at 7.37.44 AM copy.jpg
    Screenshot 2022-09-11 at 7.37.44 AM copy.jpg
    221.8 KB · Views: 16
Upvote 0
Hello there, how many occurrences will you have for one day i.e. between 1700 and 0700? like you have two logs in your example.

Is this what you are looking for as in image
Thanks for the interest -It can vary from one or two up to a thousand. We're talking microbats - night travellers. The resultant scatterchart would tell me over a short or long number of days the dominant hours they show and hence there can be an association with other questions down the track eg temp and humidity - another story.
 
Upvote 0
Thanks for the interest -It can vary from one or two up to a thousand. We're talking microbats - night travellers. The resultant scatterchart would tell me over a short or long number of days the dominant hours they show and hence there can be an association with other questions down the track eg temp and humidity - another story.
ajitel - I guess I am too involved to explain myself properly The attached image outlines the problem with some sample data with the correct time/date. The issue is getting rid of that gap between 0700 and 1700 and making the read of the data such that there is continuity in the hours

How do I attach the file itelf so you can see my data ?xb12bb looked too complex to me first up
bjk
 

Attachments

  • Image2.jpg
    Image2.jpg
    79.7 KB · Views: 10
Upvote 0
Still do not understant what you are trying to do, but let make some twists:
Book1
ABCD
3Original Date-Time stampOffset back to be on same dayDate onlyTime only
42021-09-28_17-00-0028/09/2021 14:00:0028/09/202114:00:00
52021-09-28_18-00-0028/09/2021 15:00:0028/09/202115:00:00
62021-09-28_19-00-0028/09/2021 16:00:0028/09/202116:00:00
72021-09-28_20-00-0028/09/2021 17:00:0028/09/202117:00:00
82021-09-28_21-00-0028/09/2021 18:00:0028/09/202118:00:00
92021-09-28_22-00-0028/09/2021 19:00:0028/09/202119:00:00
102021-09-28_23-00-0028/09/2021 20:00:0028/09/202120:00:00
112021-09-28_23-59-0028/09/2021 20:59:0028/09/202120:59:00
122021-09-29_01-00-0028/09/2021 22:00:0028/09/202122:00:00
132021-09-29_02-00-0028/09/2021 23:00:0028/09/202123:00:00
142021-09-29_03-00-0028/09/2021 23:59:3628/09/202123:59:36
Sheet5
Cell Formulas
RangeFormula
B4:B13B4=DATEVALUE(LEFT(A4,10))+TIMEVALUE(SUBSTITUTE(RIGHT(A4,8),"-",":"))-TIMEVALUE(SUBSTITUTE(RIGHT($A$14,8),"-",":"))
C4:C14C4=INT(B4)
D4:D14D4=MOD(B4,1)
B14B14=DATEVALUE(LEFT(A14,10))+TIMEVALUE(SUBSTITUTE(RIGHT(A14,8),"-",":"))-TIMEVALUE(SUBSTITUTE(RIGHT($A$14,8),"-",":"))-1/3600
 
Upvote 0
Sorry for the confusion but thank you for staying with me
I think I have x12bb OK now so here is the test sheet I'd been playing with including two charts which illustrate the problem
The task is to take one night's data - 28th hours and 29th hours -and make it appear as one day - 29th and cut out the daylight gap hours.. I have one chart showing the "as logged" data as it would display. The second chart has the data all inclusive to one day but not indicating sequential hours as well as a gap from 0800-1600 which is daylight. I'd like to make that look as a continuous 1700-0700 chart - no gaps

I hope this makes it a bit clearer and more usefull
If the world is kind the formulas used should be included

Cell Formulas
RangeFormula
B4:B18B4=MID(A4,1,4)
C4:C18C4=MID(A4,6,2)
D4:D18D4=MID(A4,9,2)
E4:E18E4=MID(A4,12,2)
F4:F18F4=MID(A4,15,2)
G4:G18G4=MID(A4,18,2)
H4:H18H4=CONCATENATE(E4,":",F4,":",G4)
I4:I18I4=CONCATENATE(D4,"/",C4,"/",B4)
M4:M18,J4:J18J4=VALUE(E4)
L4:L18L4=+ IF(VALUE(J4)>16,S4-1,S4)
S4:S18S4=VALUE(I4)
T4:T18T4=VALUE(H4)
 
Upvote 0
bebo02199 Been offline for a while - I'm not familiar with the ----(SUBSTITUTE(RIGHT($A$14,8) ---- component of your formulae for B Column

Could you fill me in a bit please bjk
 
Upvote 0

Forum statistics

Threads
1,214,845
Messages
6,121,902
Members
449,053
Latest member
Guy Boot

We've detected that you are using an adblocker.

We have a great community of people providing Excel help here, but the hosting costs are enormous. You can help keep this site running by allowing ads on MrExcel.com.
Allow Ads at MrExcel

Which adblocker are you using?

Disable AdBlock

Follow these easy steps to disable AdBlock

1)Click on the icon in the browser’s toolbar.
2)Click on the icon in the browser’s toolbar.
2)Click on the "Pause on this site" option.
Go back

Disable AdBlock Plus

Follow these easy steps to disable AdBlock Plus

1)Click on the icon in the browser’s toolbar.
2)Click on the toggle to disable it for "mrexcel.com".
Go back

Disable uBlock Origin

Follow these easy steps to disable uBlock Origin

1)Click on the icon in the browser’s toolbar.
2)Click on the "Power" button.
3)Click on the "Refresh" button.
Go back

Disable uBlock

Follow these easy steps to disable uBlock

1)Click on the icon in the browser’s toolbar.
2)Click on the "Power" button.
3)Click on the "Refresh" button.
Go back
Back
Top