Apologies if the title is not the best wording, I am struggling to explain my issue succinctly, but greatly appreciate any help.
I have a pivot table that draws on survey data. The survey question was multiple choice, and allowed for up to 3 options to be selected.
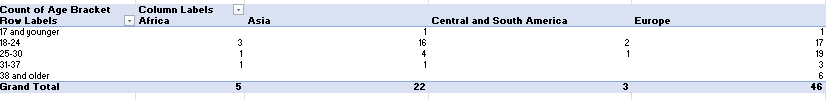
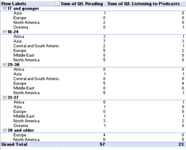
My end goal is to have the pivot in screenshot 1, show percentages rather than a count. But these percentages need to be of the specific segmented demographic i.e. how many Asian (variable 1: geography) 18- 24 year olds (variable 2: age bracket) selected the response 'reading'. Currently, the table illustrates that the response was selected 3 times by 7participants who fall into this group, however, what I would like to show is the percentage i.e. 7 out of a total 16 respondents therefore 43%.
I have explored using 'show value as' and the various options with parent total row, however, this does not take into account that individuals could respond with up to three choices, some responding with less. This throws all the percentages out e.g. for this group there were 45 total responses selected across the 16 respondents, but there could have been up to 48 responses selected by the same group.
Screenshot 2 shows the a sample of the demographic make up of the respondents, within another pivot table.
Can anyone help show me what I'm missing? I am fairly fluent in excel, and on a learning journey with pivots specifically, and have no experience in VBA so would like to avoid if possible.
Note: Both screenshots show segments of a much larger database, and the solution would be applied to multiple responses that follow the same categorical criteria.
Thanks in advance!
I have a pivot table that draws on survey data. The survey question was multiple choice, and allowed for up to 3 options to be selected.
My end goal is to have the pivot in screenshot 1, show percentages rather than a count. But these percentages need to be of the specific segmented demographic i.e. how many Asian (variable 1: geography) 18- 24 year olds (variable 2: age bracket) selected the response 'reading'. Currently, the table illustrates that the response was selected 3 times by 7participants who fall into this group, however, what I would like to show is the percentage i.e. 7 out of a total 16 respondents therefore 43%.
I have explored using 'show value as' and the various options with parent total row, however, this does not take into account that individuals could respond with up to three choices, some responding with less. This throws all the percentages out e.g. for this group there were 45 total responses selected across the 16 respondents, but there could have been up to 48 responses selected by the same group.
Screenshot 2 shows the a sample of the demographic make up of the respondents, within another pivot table.
Can anyone help show me what I'm missing? I am fairly fluent in excel, and on a learning journey with pivots specifically, and have no experience in VBA so would like to avoid if possible.
Note: Both screenshots show segments of a much larger database, and the solution would be applied to multiple responses that follow the same categorical criteria.
Thanks in advance!