slicer to multiple tables

Rubixx

New Member
Joined
Mar 9, 2021
Messages
11
Office Version
  1. 2019
Platform
  1. Windows
Hello,

I am in the process of creating a large database for hardware. There is 1 spot where I need to have 2 different pivot tables filtered with the same slicer(s).

I was informed I need to learn power query and it was set up to do 1 filter but if I have to set up connections in this manor I will have to do multiple filters. I am not seeing how exactly the file was done.

I have the category list, and 2 tables tied to it through the relationships. but I cannot duplicate the process of filtering 2 different tables. If I combined them into 1 big table I would be adding roughly 60+ lines to thousands of variations thus making this list crazy large. Also somehow the person who helped make the table into a query had my information in the same tab, but everytime I turn my data into a table then data query it puts it into a new tab and I dont know why.

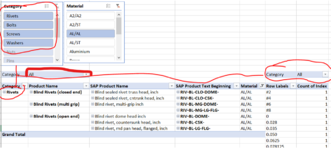
my ultimate goal is on the picture attached, 2 pivot tables 1 slicer, i will be doing this with multiple filters, just need to learn how to do the 1st one first.
 

Attachments

  • Slicer question2.PNG
    Slicer question2.PNG
    83.6 KB · Views: 13

Excel Facts

Workdays for a market open Mon, Wed, Friday?
Yes! Use "0101011" for the weekend argument in NETWORKDAYS.INTL or WORKDAY.INTL. The 7 digits start on Monday. 1 means it is a weekend.
If you already have the relationship set up between the tables you should just need to right click the slicer, select "report connections" and then select the pivot tables the slicer works on.
 
Upvote 0
Absolutely thats what i understand as well. But for some reason its not making the filter still. Is there anything i could upload to show you? It could be in not seeing a final step. But I am not sure. Only 1 table filters off thenslicer. Not both
 
Upvote 0

Or many other sites could be used. I'll be unable to reply for around 13 hours however. Someone may assist in the meantime
 
Upvote 0
Very sorry ive been meaning to reply all day ... Download Data package from March 11th.

I attached 2 files on there, on the file ending in TB is where he created his data query but they are in the same tab unlike mine. and then in my file sheet 2 and slicer project are 2 in the same. I was testing them in new tabs in case I did something wrong. but either way if you see on the TB file tab slicer if you click on bolt both pivot tables will update to bolt. unlike on mine.

as sometimes its been hard to clarify I need these as 2 seperate pivots (even if they are from the same table if that is possible) each variation could have 40-60 different dimensions. mean in this basic format there are only 800-900 lines but it will grow to be a few thousand, and I cant imagine a few thousand varieties having to be created 40-60 times each just to have the dimensions if that makes any sense.

also not all the data on the cat list is on the dimensions "tab" as its a rough draft atm. the tab name dimension is just a table version of the one labeled dimension tab which has no links associated.
if it helps at all I am still fairly new to pivot tables and slicers, I get the basics of them but if there is a simple fix or a solution (not using data validation lists) I am all ears. making it from slicers is really the only optimal way as there is a large amount of data that would be hard to use as formulas.
 
Upvote 0
I see what you've done with this:

1615497032345.png


Note: We used to do similar and create something like Cat_List because we could not have a many to many relationship between the other 2 tables. IF you have done the same i'd just suggest to you that you have problems with the logic of your model. I can't be certain but it's worth considering.

Look at sheet 2 of the attached. I have added the slicer [Cat_List].[Category]. Note this had no effect on filtering the tables until I added something to the Values in the Pivot Tables. If you take the values out you'll see the filtered items change. You may need to just hide these columns if no values will be entered.


Does it now do what you want?
 
Upvote 0
I see what you've done with this:

View attachment 34162

Note: We used to do similar and create something like Cat_List because we could not have a many to many relationship between the other 2 tables. IF you have done the same i'd just suggest to you that you have problems with the logic of your model. I can't be certain but it's worth considering.

Look at sheet 2 of the attached. I have added the slicer [Cat_List].[Category]. Note this had no effect on filtering the tables until I added something to the Values in the Pivot Tables. If you take the values out you'll see the filtered items change. You may need to just hide these columns if no values will be entered.


Does it now do what you want?
ok so this is definitely doing what I want from what I can tell. is all you did was add the values? I noticed that you it filters as it and doesnt even use the filters up top which is perfect, does that mean I can by pass power query altogether or was this still needing power query. becasue I can just hide the totals.
 
Upvote 0
ok so this is definitely doing what I want from what I can tell. is all you did was add the values? I noticed that you it filters as it and doesnt even use the filters up top which is perfect, does that mean I can by pass power query altogether or was this still needing power query. becasue I can just hide the totals.
wow sorry for the typos I was excited. you didnt end up changing the filters I had set up through the pivot table is what I meant. So in this scenerio I need to make sure I add another category list (different name but same concept) for any additional filters I need then can create a slicer in the same manor since the values are on there? thank you very much
 
Upvote 0

Forum statistics

Threads
1,214,386
Messages
6,119,217
Members
448,876
Latest member
Solitario

We've detected that you are using an adblocker.

We have a great community of people providing Excel help here, but the hosting costs are enormous. You can help keep this site running by allowing ads on MrExcel.com.
Allow Ads at MrExcel

Which adblocker are you using?

Disable AdBlock

Follow these easy steps to disable AdBlock

1)Click on the icon in the browser’s toolbar.
2)Click on the icon in the browser’s toolbar.
2)Click on the "Pause on this site" option.
Go back

Disable AdBlock Plus

Follow these easy steps to disable AdBlock Plus

1)Click on the icon in the browser’s toolbar.
2)Click on the toggle to disable it for "mrexcel.com".
Go back

Disable uBlock Origin

Follow these easy steps to disable uBlock Origin

1)Click on the icon in the browser’s toolbar.
2)Click on the "Power" button.
3)Click on the "Refresh" button.
Go back

Disable uBlock

Follow these easy steps to disable uBlock

1)Click on the icon in the browser’s toolbar.
2)Click on the "Power" button.
3)Click on the "Refresh" button.
Go back
Back
Top