Somewhat Complex Sumifs Formula

DPChristman

Board Regular
Joined
Sep 4, 2012
Messages
171
Office Version
  1. 365
Platform
  1. Windows
I think my formula writing is rusty, because I have been racking my brain all morning with this

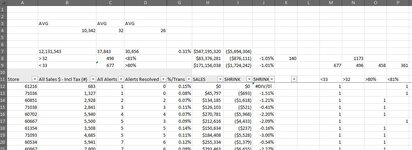
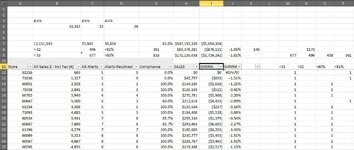
I have a list of Approximately 1,200 retail locations that I am working with.

I am trying to total sales and loss in these stores based on the following criteria:

Operational Alerts Received is less than 33 (on the flip side, greater than 32), and alert compliance greater than 80.99999% (on the flip side, less than 81%)

I have done this type of formula before, but I think my brain is mush
 

Excel Facts

What is the last column in Excel?
Excel columns run from A to Z, AA to AZ, AAA to XFD. The last column is XFD.
not sure what column you are using, also what does FLIP SIDE mean, separate calculation

Not sure on SALES & LOSSES - where are these recorded

=SUMIFS( SUM_RANGE, Criteria, column with OPERATION Alerts in , "<"&33 , Criteria column with alert compliance, ">"&0.8099999 )

=SUMIFS( SUM_RANGE, Criteria, column with OPERATION Alerts in , ">"&32 , Criteria column with alert compliance, "<"&0.81 )
 
Upvote 0
I'm also not sure if I'm following but here's an attempt.

DPChristman.xlsx
ABCDEFGHI
1CompanySalesLossOperational AlertAlert ComplianceSalesLoss
2ACME22000120003380%Op. Alerts < 33, Compliance >= 8115300030000
3Bodgit33000130003281%Op. Alerts >= 33, Compliance < 817700027000
4Whitman44000140004490%
5Tensor55000150005575%
6Peachtree66000160001275%
7SumpCatch120000170001282%
8
Sheet1
Cell Formulas
RangeFormula
H2:I2H2=SUMIFS(B$2:B$9999,$D$2:$D$9999,"<33",$E$2:$E$9999,">=81%")
H3:I3H3=SUMIFS(B$2:B$9999,$D$2:$D$9999,">=33",$E$2:$E$9999,"<81%")
 
Upvote 0
not sure what column you are using, also what does FLIP SIDE mean, separate calculation

Not sure on SALES & LOSSES - where are these recorded

=SUMIFS( SUM_RANGE, Criteria, column with OPERATION Alerts in , "<"&33 , Criteria column with alert compliance, ">"&0.8099999 )

=SUMIFS( SUM_RANGE, Criteria, column with OPERATION Alerts in , ">"&32 , Criteria column with alert compliance, "<"&0.81 )
 

Attachments

  • Agilence Report.JPG
    Agilence Report.JPG
    99.7 KB · Views: 6
Upvote 0
Reworded and relabeled to make it easier to follow. What I am looking for is a way to show that if a store (Column A) had more than the company average of 32 alerts (Column C), and Alert Compliance (Column E) was below 81% (comp Avg), how did that impact the store's shrinkage based on the sales and shrink column (I&J).

On the same note, what was the affect in stores with less that 33 alerts, and 81% or better compliance. (image attached)
 

Attachments

  • Report.JPG
    Report.JPG
    126.1 KB · Views: 4
Upvote 0
Sorry, I'm still not following
can you give some examples of results expected , and why

how many rows per company ? Just 1
If just 1 row, then not sure why SUMIFS
how did that impact the store's shrinkage based on the sales and shrink column (I&J).
What do you want to know from I & J ?
They are just numbers , so how do you Rate/measure Impact ?
Below the Companies Average - Above ?
OR what
 
Upvote 0
Overall what I need to accomplish is, if a group of stores has higher than average alerts, and lower than average compliance, what is the combined sales / shrink
The other side of that is that if a group of stores has less than average number of alerts, and better than average compliance, what is the combine sales / shrink
Ideally, I want to show that if the stores (in general) have less than average alerts generated by transactions, and were more compliant in dealing with these alerts, they had a better shrink result.
 
Upvote 0

Forum statistics

Threads
1,214,895
Messages
6,122,128
Members
449,066
Latest member
Andyg666

We've detected that you are using an adblocker.

We have a great community of people providing Excel help here, but the hosting costs are enormous. You can help keep this site running by allowing ads on MrExcel.com.
Allow Ads at MrExcel

Which adblocker are you using?

Disable AdBlock

Follow these easy steps to disable AdBlock

1)Click on the icon in the browser’s toolbar.
2)Click on the icon in the browser’s toolbar.
2)Click on the "Pause on this site" option.
Go back

Disable AdBlock Plus

Follow these easy steps to disable AdBlock Plus

1)Click on the icon in the browser’s toolbar.
2)Click on the toggle to disable it for "mrexcel.com".
Go back

Disable uBlock Origin

Follow these easy steps to disable uBlock Origin

1)Click on the icon in the browser’s toolbar.
2)Click on the "Power" button.
3)Click on the "Refresh" button.
Go back

Disable uBlock

Follow these easy steps to disable uBlock

1)Click on the icon in the browser’s toolbar.
2)Click on the "Power" button.
3)Click on the "Refresh" button.
Go back
Back
Top