Speedometer/Gauge Help

beloshi

New Member
Joined
Jul 5, 2018
Messages
29
Hi Excel Gurus,

Once again thanks to this platform that I've been learning alot with my VBA macro skills, helping me a lot to shorten my spending my time on one task. I need the suggestion of one speedometer/gauge chart which I am creating I want to add labels to it for example , 0, 10, 20, 30, 40, ------100 around it.

Let me explain some important points for explanation,

I am using combo chart to create Gauge (Donut + Pie Chart) but I am able to put the label on the pointer. But unfortunately I tried to put label on the gauge as explained above.

Please see images for better understanding and as it is mix of two charts and area is already defined in it the lables will work according to the perimeters is it possible to define the labels manually.
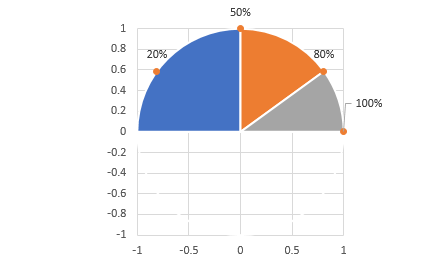
ORIGINAL IMAGE

https://imgur.com/hBXvhqG


DESIRED RESULTS

https://imgur.com/CmScvhX


Please your valuable suggestion in achieving this will be highly appreciable.

Added requirement (This is the additional requirement if possible to achieve)

If it can be achieved with vba macro I would also like to know. to create the chart automatically.
 
Last edited:

Excel Facts

What is the shortcut key for Format Selection?
Ctrl+1 (the number one) will open the Format dialog for whatever is selected.
You can add an XY series to the chart with the following coordinates:


Cell Formulas
RangeFormula
J3=RADIANS(180-I3*180)
J4=RADIANS(180-I4*180)
J5=RADIANS(180-I5*180)
J6=RADIANS(180-I6*180)
K3=COS(J3)
K4=COS(J4)
K5=COS(J5)
K6=COS(J6)
L3=SIN(J3)
L4=SIN(J4)
L5=SIN(J5)
L6=SIN(J6)


then set the minimum and maximum of both axis to -1 and 1 respectively and hide gridlines and axis labels and use the Add Values From cells feature to add the labels


qBewGmh.png


On a side note, I think bullet charts are a better alternative for your problem: learn how to create one

bullet-charts-in-excel
 
Upvote 0
You can add an XY series to the chart with the following coordinates:

IJKL
2XY
320%2.513274-0.8090169940.587785
450%1.5707966.12574E-171
580%0.6283190.8090169940.587785
6100%010

<colgroup><col style="width: 25pxpx"><col><col><col><col></colgroup><thead>
</thead><tbody>
</tbody>
Sheet2

Worksheet Formulas
CellFormula
J3=RADIANS(180-I3*180)
K3=COS(J3)
L3=SIN(J3)
J4=RADIANS(180-I4*180)
K4=COS(J4)
L4=SIN(J4)
J5=RADIANS(180-I5*180)
K5=COS(J5)
L5=SIN(J5)
J6=RADIANS(180-I6*180)
K6=COS(J6)
L6=SIN(J6)

<thead>
</thead><tbody>
</tbody>

<tbody>
</tbody>


then set the minimum and maximum of both axis to -1 and 1 respectively and hide gridlines and axis labels and use the Add Values From cells feature to add the labels


qBewGmh.png


On a side note, I think bullet charts are a better alternative for your problem: learn how to create one

bullet-charts-in-excel
Thanks for taking out time to reply, I am confused as to how do I plot these can you tell me which Chart should I select for it now i.e. Scatter etc. Please excuse my nuisance.

With Best regards

beloshi
 
Upvote 0
Thanks for taking out time to reply, I am confused as to how do I plot these can you tell me which Chart should I select for it now i.e. Scatter etc. Please excuse my nuisance.

With Best regards

beloshi


To the chart you have now you need to add an XY series with the coordinates I showed above. At the end your chart will be a combo chart with a pie, doughnut and a XY scatter
 
Last edited:
Upvote 0
To the chart you have now you need to add an XY series with the coordinates I showed above. At the end your chart will be a combo chart with a pie, doughnut and a XY scatter

Thank you very much for the help. It worked like a charm
 
Last edited:
Upvote 0

Forum statistics

Threads
1,214,653
Messages
6,120,752
Members
448,989
Latest member
mariah3

We've detected that you are using an adblocker.

We have a great community of people providing Excel help here, but the hosting costs are enormous. You can help keep this site running by allowing ads on MrExcel.com.
Allow Ads at MrExcel

Which adblocker are you using?

Disable AdBlock

Follow these easy steps to disable AdBlock

1)Click on the icon in the browser’s toolbar.
2)Click on the icon in the browser’s toolbar.
2)Click on the "Pause on this site" option.
Go back

Disable AdBlock Plus

Follow these easy steps to disable AdBlock Plus

1)Click on the icon in the browser’s toolbar.
2)Click on the toggle to disable it for "mrexcel.com".
Go back

Disable uBlock Origin

Follow these easy steps to disable uBlock Origin

1)Click on the icon in the browser’s toolbar.
2)Click on the "Power" button.
3)Click on the "Refresh" button.
Go back

Disable uBlock

Follow these easy steps to disable uBlock

1)Click on the icon in the browser’s toolbar.
2)Click on the "Power" button.
3)Click on the "Refresh" button.
Go back
Back
Top