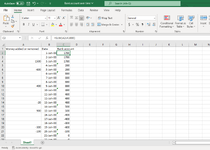
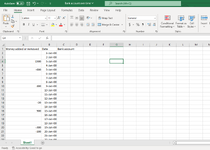
So I have an excel sheet like in the first image. Column 'A' shows how much money is being added or removed from a bank account on a particular date, column 'B' is the date that money was added or removed, and column 'C' is supposed to show the sum total of the money in the bank account on each day.
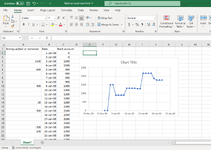
Columns 'B' and 'C' are eventually going to be highlighted and used to make a scatter plot graph showing the rise and fall of money in a bank account over time.
What can I do to make it so column 'C' correctly displays the sum total of money in a bank account?
Three images have been attached to this post to explain the question.
Now what I can do is just manually type in the sum total number in column 'C' but that would take months to type out.
I tried typing in the function "=SUM(A2:A1000)" into the cell "C2" and dragged it down, but as we can see from the attached image, that clearly doesn't work.
Any solutions?
")


