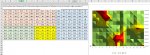
I have created a surface graph and I observe the orientation of the graph is not aligned with the orientation of data points. How do I align it so that the graph represents the data points. For example ref:P5( value 90) is located vertically at the bottom of the chart at the intersection of 16/series 1 intersection. How can I set it in the right orientation as the data table?
This will be a great help. Thanking you all for your help.
AFD
This will be a great help. Thanking you all for your help.
AFD