I have a bunch of code below that basically plots shapes on a chart with connectors to text boxes to be used as labels for the shapes onto a chart (Thanks to Chandoo.org experts!!)
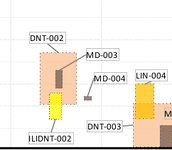
Basically, the question is "Can code be added to this procedure or add a procedure that will check all text boxes and align them off of each other automatically so that they do not overlap with each other or any other shape?"
Basically, the question is "Can code be added to this procedure or add a procedure that will check all text boxes and align them off of each other automatically so that they do not overlap with each other or any other shape?"
VBA Code:
Sub Plot_ILI_Features()


Dim response As String
 Dim ldrlines As Boolean
 ldrlines = False

  response = MsgBox("Would you like leader lines from the label to indication?." & vbNewLine & vbNewLine _
        & "", vbYesNoCancel)
  If response = vbCancel Then
  Exit Sub
  End If
  If response = vbYes Then
  ldrlines = True
  If response = vbNo Then
  End If
  End If

'Get chart properties

Dim pl As Double
Dim pw As Double
Dim pt As Double
Dim ph As Double

Dim wsChart As Worksheet
Dim wsData As Worksheet

Dim oChObj As ChartObject

Set wsData = Sheets("Corr. Table")
Set wsChart = Sheets("Indication Map")
Const Pi As Double = 3.141592654
On Error GoTo eh

wsChart.Activate

Dim axmin As Double, axmax As Double

axmin = wsChart.Range("inspstart")
axmax = wsChart.Range("inspend")

'Get chart size/location
With wsChart
  pl = Range("E11").Left '- 7.5                            'Left zero ref from left
  pw = Range("O10").Left - Range("E34").Left '- 5       'Length of plot area
  pt = Range("E11").Top '- 1.5                             'Top zero ref of plot area
  ph = Range("O34").Top - Range("E10").Top '+ 2        'Height of plot area
End With

If axmax - axmin < 1 Then
MsgBox ("Verify Assessment Area Start and End in Master Page")
GoTo eh
End If


'Loop through Range
Dim lr As Long
lr = wsData.Range("C" & Rows.Count).End(xlUp).row

If lr < 7 Then
MsgBox ("Verify Correlation Table has ILI calls listed from Form F or Form G.")
GoTo eh
End If


Dim i As Integer
Dim PipeDia As Double
Dim ol As Double, ot As Double
Dim ow As Double, oh    As Double
Dim onm As String, ccode As String
Dim width As Double

PipeDia = Range("Nominal_Pipe_Diameter").Value2


  If PipeDia = 0 Then
  MsgBox ("Check Pipe Diameter in Master Page")
  GoTo eh
  End If

For i = 7 To lr 'Row 7 is first row of data
  'Get data for each Rectangle
  ccode = "ILI"
  ol = wsData.Cells(i, 24)                          'axial distance from start
  ot = wsData.Cells(i, 29)                          'clock position
  ow = wsData.Cells(i, 34)                          'length
  width = wsData.Cells(i, 38)


   'Creates minimum size for rectangle to be visible
  If width < 0.5 Then
  width = 1
  End If

  If ow < 0.5 Then 'length
  ow = 1
  End If


  oh = 720 * (width / (PipeDia * Pi)) 'width converted to mins
  onm = "ILI" + Format(wsData.Cells(i, 3), "-#") 'text box name

  'Corrects clock for 12:00 to 1:00
  If ot >= 0.5 Then
  ot = ot - 0.5
  End If

  'Process Rect location/size
  Dim shl As Double, Sht As Double, shw As Double, shh As Double

  shl = pl + pw * (ol - axmin) / (axmax - axmin)   'box axial start

 'If sht >
  Sht = pt + ot * ph / 0.5                         'box circ start
  shw = pw * ow / ((axmax - axmin) * 12)           'box width
  shh = ph * oh / (12 * 60)                        'box height
   'MsgBox ("Clock pos = " & ot)
   'MsgBox (sht)

  ' Adjust to edges of Plot Area
    Dim PlotOverlap As Boolean
  PlotOverlap = True 'True allows overlap, False stops overlap

  If Not PlotOverlap Then
    'check left edge
    If shl < pl Then
      shl = pl
      shw = shw - (pl - (pl + pw * (ol - axmin) / (axmax - axmin)))
    End If
    'check Right edge
    If shl + shw > pl + pw Then
      shw = pl + pw - shl
    End If
  End If

  'Setup Color Fill settings
  Dim mycolor As Double
  mycolor = Range("colorcode").Find(ccode, , , xlWhole).Interior.Color


  Dim DrawOutLine  As Boolean
  DrawOutLine = True 'Draw Rectangle Outline ?

  'Add Rectangle
  Dim plotwrap As Boolean

  plotwrap = True 'True allows Vertical Wrap, False stops Vertical Wrap

  Dim s1, s2, s3, t1, t2, t3 As Shape
  Dim conn1, conn2, conn3 As Shape
  Dim sht_Offset As Double

  If plotwrap And (Sht + shh) > (pt + ph) Then 'If Rectangle plots across 12:00
      'plot bottom of Rectangle
      ActiveSheet.Shapes.AddShape(msoShapeRectangle, shl, Sht - 4.5, shw, pt + ph - Sht).Select
      'Color Bottom half of Rectangle
      Call ColorShape(mycolor, DrawOutLine)
      Set s1 = ActiveSheet.Shapes(Selection.Name)
    '  MsgBox ("Circ Start: " & sht)
      'plot top of Rectangle
      Application.CutCopyMode = False
      ActiveSheet.Shapes.AddShape(msoShapeRectangle, shl, pt, shw, shh - (pt + ph - Sht)).Select
      'MsgBox (sht)
      Set s2 = ActiveSheet.Shapes(Selection.Name)
  Else
      ActiveSheet.Shapes.AddShape(msoShapeRectangle, shl, Sht, shw, shh).Select
      'MsgBox (sht)
      Set s3 = ActiveSheet.Shapes(Selection.Name)
  End If

  'Color Rectangle
  Call ColorShape(mycolor, DrawOutLine)

    If plotwrap And (Sht + shh) > (pt + ph) Then
  'Add text box for bottom rectangle
  sht_Offset = 15 'Offset from top of Rectangle
  ActiveSheet.Shapes.AddTextbox(msoTextOrientationHorizontal, shl, ph - pt + 2, shw, shh - (pt + ph - Sht)).Select
  With Selection.ShapeRange.TextFrame2
     .VerticalAnchor = msoAnchorMiddle
    .MarginLeft = 0
    .MarginRight = 0
    .MarginTop = 0
    .MarginBottom = 0
    .WordWrap = False
    .AutoSize = msoAutoSizeShapeToFitText
    .TextRange.Characters.Text = onm
  End With

  Selection.ShapeRange.Line.Visible = msoTrue 'Plot Textbox border
  Selection.ShapeRange.Fill.Visible = msoFalse

  With Selection.ShapeRange(1).TextFrame2.TextRange.Characters(1, Len(onm)).ParagraphFormat
    .FirstLineIndent = 0
    .Alignment = msoAlignLeft ' Change Text alignment here
  End With
  With Selection.ShapeRange(1).TextFrame2.TextRange.Characters(1, Len(onm)).Font
    .NameComplexScript = "+mn-cs"
    .NameFarEast = "+mn-ea"
    .Size = 8 'Text size
    .Name = "+mn-lt"
  End With
  If ldrlines = True Then

    Set t1 = ActiveSheet.Shapes(Selection.Name)
    Set conn1 = ActiveSheet.Shapes.AddConnector(msoConnectorStraight, 0, 0, 0, 0)
    ' Connect shapes
   conn1.ConnectorFormat.BeginConnect s2, 1
   conn1.ConnectorFormat.EndConnect t1, 1
    conn1.Line.ForeColor.RGB = RGB(128, 128, 128)
    ' Connect via shortest path (changes connection sites)
    conn1.RerouteConnections
  'Add text box for top rectangle
  End If

  sht_Offset = 15 'Offset from top of Rectangle
  ActiveSheet.Shapes.AddTextbox(msoTextOrientationHorizontal, shl, Sht - 12, shw, pt + ph - Sht).Select
  With Selection.ShapeRange.TextFrame2
    .VerticalAnchor = msoAnchorMiddle
    .MarginLeft = 0
    .MarginRight = 0
    .MarginTop = 0
    .MarginBottom = 0
    .WordWrap = False
    .AutoSize = msoAutoSizeShapeToFitText
    .TextRange.Characters.Text = onm
  End With

  Selection.ShapeRange.Line.Visible = msoTrue 'Plot Textbox border
  Selection.ShapeRange.Fill.Visible = msoFalse

  With Selection.ShapeRange(1).TextFrame2.TextRange.Characters(1, Len(onm)).ParagraphFormat
    .FirstLineIndent = 0
    .Alignment = msoAlignLeft ' Change Text alignment here
  End With
  With Selection.ShapeRange(1).TextFrame2.TextRange.Characters(1, Len(onm)).Font
    .NameComplexScript = "+mn-cs"
    .NameFarEast = "+mn-ea"
    .Size = 8 'Text size
    .Name = "+mn-lt"
  End With
   If ldrlines = True Then
   Set t2 = ActiveSheet.Shapes(Selection.Name)

   Set conn2 = ActiveSheet.Shapes.AddConnector(msoConnectorStraight, 0, 0, 0, 0)
   ' Connect shapes
    conn2.ConnectorFormat.BeginConnect t2, 1
    conn2.ConnectorFormat.EndConnect s1, 1
    conn2.Line.ForeColor.RGB = RGB(128, 128, 128)
    ' Connect via shortest path (changes connection sites)
    conn2.RerouteConnections
   End If
Else
  sht_Offset = 15 'Offset from top of Rectangle
  ActiveSheet.Shapes.AddTextbox(msoTextOrientationHorizontal, shl, Sht - sht_Offset, shw, 20).Select
  With Selection.ShapeRange.TextFrame2
    .VerticalAnchor = msoAnchorMiddle
    .MarginLeft = 0
    .MarginRight = 0
    .MarginTop = 0
    .MarginBottom = 0
    .WordWrap = False
    .AutoSize = msoAutoSizeShapeToFitText
    .TextRange.Characters.Text = onm
  End With

  Selection.ShapeRange.Line.Visible = msoTrue 'Plot Textbox border
  Selection.ShapeRange.Fill.Visible = msoFalse

  With Selection.ShapeRange(1).TextFrame2.TextRange.Characters(1, Len(onm)).ParagraphFormat
    .FirstLineIndent = 0
    .Alignment = msoAlignLeft ' Change Text alignment here
  End With
  With Selection.ShapeRange(1).TextFrame2.TextRange.Characters(1, Len(onm)).Font
    .NameComplexScript = "+mn-cs"
    .NameFarEast = "+mn-ea"
    .Size = 8 'Text size
    .Name = "+mn-lt"
  End With
If ldrlines = True Then
  Set t3 = ActiveSheet.Shapes(Selection.Name)
  Set conn3 = ActiveSheet.Shapes.AddConnector(msoConnectorStraight, 0, 0, 0, 0)
    ' Connect shapes
    conn3.ConnectorFormat.BeginConnect s3, 1
    conn3.ConnectorFormat.EndConnect t3, 1
    conn3.Line.ForeColor.RGB = RGB(128, 128, 128)
    ' Connect via shortest path (changes connection sites)
    conn3.RerouteConnections
  End If
  End If


Next i

'Bring all Textboxes to Front

Dim oTextBox As TextBox

For Each oTextBox In ActiveSheet.TextBoxes
  If Left(oTextBox.Name, 4) = "Text" Then
    oTextBox.Select
    Selection.ShapeRange.ZOrder msoBringToFront
  '  Selection.ShapeRange.Fill.Visible = msoCTrue
  End If
Next oTextBox

Range("A1").Select

eh:

Application.EnableEvents = True
Application.ScreenUpdating = True
End Sub