luckeyjune
New Member
- Joined
- Jun 28, 2021
- Messages
- 12
- Office Version
- 2016
- Platform
- Windows
Hello,
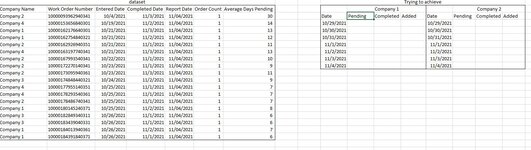
Trying to see if anyone has ideas on how they'd approach this. I have a dataset with an entered date, completed date, and a report rundate for work orders. It also contains a days pending #. What I'm trying to do, with a series of helper columns, is to come up with a sum of how many work orders were pending for a certain company on a certain day. But, the dataset can't be run each day, so I will have to retroactively determine whether something was pending or not, on a given day. I can determine that by figuring out whether the date I'm querying falls between the enter and completed date. If it does, then it was pending on any date between entered and completed. The actual dataset is very large, so I can't use array formulas. And, the chart or pivot table I'd like to be the end result will need to be rolled up to Company level, so I'll have to be able to SUM the 1,0 result. I'd like to run this 5x/week, and have it auto-update for how many work orders were pending on a given date, based on whether that given date falls between entered and completed. I added an example of what my dataset looks like, and also what I'm trying to achieve (roughly). In the "pending" column on the chart I'm trying to achieve, that would be a SUM of how many work orders were pending on that date. I'd love any ideas. Thanks so much!
Trying to see if anyone has ideas on how they'd approach this. I have a dataset with an entered date, completed date, and a report rundate for work orders. It also contains a days pending #. What I'm trying to do, with a series of helper columns, is to come up with a sum of how many work orders were pending for a certain company on a certain day. But, the dataset can't be run each day, so I will have to retroactively determine whether something was pending or not, on a given day. I can determine that by figuring out whether the date I'm querying falls between the enter and completed date. If it does, then it was pending on any date between entered and completed. The actual dataset is very large, so I can't use array formulas. And, the chart or pivot table I'd like to be the end result will need to be rolled up to Company level, so I'll have to be able to SUM the 1,0 result. I'd like to run this 5x/week, and have it auto-update for how many work orders were pending on a given date, based on whether that given date falls between entered and completed. I added an example of what my dataset looks like, and also what I'm trying to achieve (roughly). In the "pending" column on the chart I'm trying to achieve, that would be a SUM of how many work orders were pending on that date. I'd love any ideas. Thanks so much!