Trying to plot Team breaks in a Graph

jeevananand

New Member
Joined
Dec 17, 2022
Messages
1
Office Version
  1. 365
  2. 2021
Platform
  1. Windows
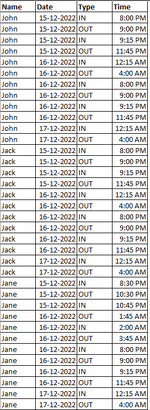
I'm trying to plot a graph to track my team login and break activity, Shift Time: Starts at 8:00 PM and Ends the next day at 4:00 AM, with multiple breaks (IN/OUT) during the day. I want to plot a Stacked Bar or Line graph showing the Employees with a duration between IN and OUT shown in Green and the Breaks which is OUT to IN time in Red
 

Attachments

  • image_2022-12-18_063255793.png
    image_2022-12-18_063255793.png
    16.3 KB · Views: 4

Excel Facts

Select all contiguous cells
Pressing Ctrl+* (asterisk) will select the "current region" - all contiguous cells in all directions.

Forum statistics

Threads
1,214,606
Messages
6,120,497
Members
448,967
Latest member
visheshkotha

We've detected that you are using an adblocker.

We have a great community of people providing Excel help here, but the hosting costs are enormous. You can help keep this site running by allowing ads on MrExcel.com.
Allow Ads at MrExcel

Which adblocker are you using?

Disable AdBlock

Follow these easy steps to disable AdBlock

1)Click on the icon in the browser’s toolbar.
2)Click on the icon in the browser’s toolbar.
2)Click on the "Pause on this site" option.
Go back

Disable AdBlock Plus

Follow these easy steps to disable AdBlock Plus

1)Click on the icon in the browser’s toolbar.
2)Click on the toggle to disable it for "mrexcel.com".
Go back

Disable uBlock Origin

Follow these easy steps to disable uBlock Origin

1)Click on the icon in the browser’s toolbar.
2)Click on the "Power" button.
3)Click on the "Refresh" button.
Go back

Disable uBlock

Follow these easy steps to disable uBlock

1)Click on the icon in the browser’s toolbar.
2)Click on the "Power" button.
3)Click on the "Refresh" button.
Go back
Back
Top