two vertical axis graph

Oversteer

New Member
Joined
Nov 27, 2022
Messages
6
Office Version
  1. 2016
Platform
  1. Windows
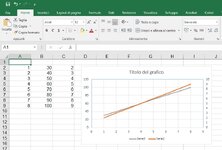
Good evening everyone. In a scatter graph there are two sets of values (from 30 to 100 the first and from 2 to 9 the second). Since the second set of values would be flattened down and not very visible, I decide to move this serie to the secondary axis; I find the first scale to be 0-120 and the second from 0-10. Six division against 5. I'm trying to "extract" the method Excel uses to automatically set the scales to write alternatively: a formula inside the graph options to align scales to the same number of divisions, or a macro that takes the second scale and adapts it to the first so that you have the same number of divisions. If 100 becomes 120, and the first scale becomes 0-140, the second scale should also follow. Any ideas to do it simply? Thank you all in advance. Albert
 

Attachments

  • scale_grafico.jpg
    scale_grafico.jpg
    100.6 KB · Views: 11

Excel Facts

What is the fastest way to copy a formula?
If A2:A50000 contain data. Enter a formula in B2. Select B2. Double-click the Fill Handle and Excel will shoot the formula down to B50000.
Hi Oversteer. You can adjust this bit of code to suit. HTH. Dave
Code:
Dim ChtCnt As Integer
ChtCnt = Sheets("Sheet1").ChartObjects.Count
With Sheets("Sheet1").ChartObjects(ChtCnt).Chart.Axes(xlValue, xlPrimary)
.MajorUnit = ((.MaximumScale - .MinimumScale) / 6)
End With

With Sheets("Sheet1").ChartObjects(ChtCnt).Chart.Axes(xlValue, xlSecondary)
.MajorUnit = ((.MaximumScale - .MinimumScale) / 6)
End With
 
Upvote 0
Hi Oversteer. You can adjust this bit of code to suit. HTH. Dave
Code:
Dim ChtCnt As Integer
ChtCnt = Sheets("Sheet1").ChartObjects.Count
With Sheets("Sheet1").ChartObjects(ChtCnt).Chart.Axes(xlValue, xlPrimary)
.MajorUnit = ((.MaximumScale - .MinimumScale) / 6)
End With

With Sheets("Sheet1").ChartObjects(ChtCnt).Chart.Axes(xlValue, xlSecondary)
.MajorUnit = ((.MaximumScale - .MinimumScale) / 6)
End With
Thank you NdNoviceHlp, I'll try to adapt your code to make sure it can work for every number of divisions and not only 6.
six was just on my example the key point I'm try to make is whichever number of division the first scale gets, the second will always be aligned on the same value
 
Upvote 0
You are welcome. You can change the 6 to whatever. A common variable for the 2 axes in place of the 6 seems like it would be best for you. Maybe your first scale /20 would produce your value for the common variable. Dave
 
Upvote 0
You are welcome. You can change the 6 to whatever. A common variable for the 2 axes in place of the 6 seems like it would be best for you. Maybe your first scale /20 would produce your value for the common variable. Dave
Dave, thanks again; this is the way I'll probably go, even though it's still belonging to the "try and error" category... The best would be if we know the formula used by excel to define the three values MaximumScale, MinimumScale and MajorUnit. For example, does excel first calculate the majorunit with the input values and then round up and round down to get Max and Min, or viceversa? If I could embed the same formula in the macro, then I don't need to go for trials because I could predict the values in advance and cross them with the second set of data being sure they will fit. Does anyone knows these rules?
 
Upvote 0
You know what the maximum and minimum values are by the data that is charted and you can control the major unit all with VBA....
Code:
With Sheets("Sheet1").ChartObjects(ChtCnt).Chart.Axes(xlValue, xlPrimary)
.MinimumScale = Sheets("Sheet1").Cells(1, 2).Value
.MaximumScale = Sheets("Sheet1").Cells(LastRow, 2).Value
.MajorUnit = ((.MaximumScale - .MinimumScale) / 6)
End With
Where Sheet1 B1 has the minimum data and B & LastRow has the maximum data value. It's very unlikely that anyone will be able to give you the "formula" used by excel to define the values... it's hard to say if MS even knows sometimes. It's better just to directly control these values with VBA as above. HTH. Dave
 
Upvote 0
Solution

Forum statistics

Threads
1,214,533
Messages
6,120,076
Members
448,943
Latest member
sharmarick

We've detected that you are using an adblocker.

We have a great community of people providing Excel help here, but the hosting costs are enormous. You can help keep this site running by allowing ads on MrExcel.com.
Allow Ads at MrExcel

Which adblocker are you using?

Disable AdBlock

Follow these easy steps to disable AdBlock

1)Click on the icon in the browser’s toolbar.
2)Click on the icon in the browser’s toolbar.
2)Click on the "Pause on this site" option.
Go back

Disable AdBlock Plus

Follow these easy steps to disable AdBlock Plus

1)Click on the icon in the browser’s toolbar.
2)Click on the toggle to disable it for "mrexcel.com".
Go back

Disable uBlock Origin

Follow these easy steps to disable uBlock Origin

1)Click on the icon in the browser’s toolbar.
2)Click on the "Power" button.
3)Click on the "Refresh" button.
Go back

Disable uBlock

Follow these easy steps to disable uBlock

1)Click on the icon in the browser’s toolbar.
2)Click on the "Power" button.
3)Click on the "Refresh" button.
Go back
Back
Top