UDF Function to manipulate charts - great article needs tweaking for my purpose

mountainman88

Board Regular
Joined
Jun 22, 2019
Messages
109
Office Version
  1. 2016
Platform
  1. Windows
I found this great article for creating a UDF to manipulate charts and it works great.
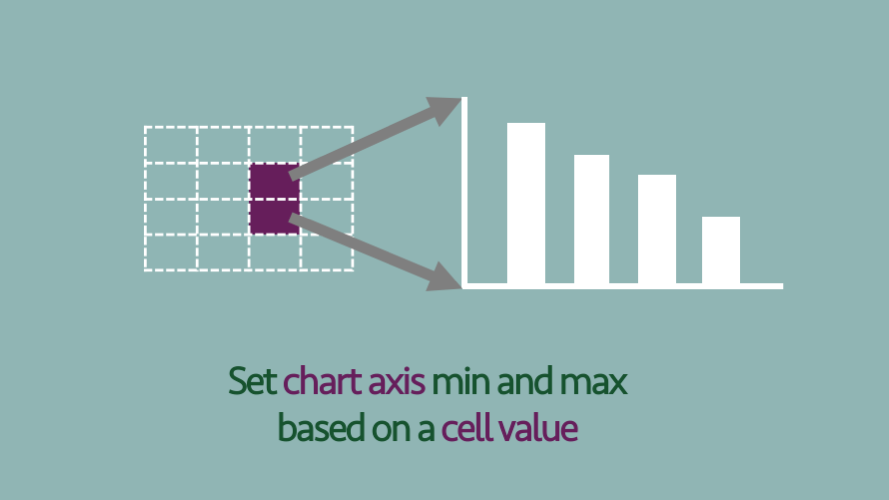

How can I modify this to create a UDF where I can link 1) chart title where the UDF argument is a cell 2) The data range for the chart,where the UDF argument is a range of cells (this would be the same as the data source range when setting up the chart)

Thanks!
 

Excel Facts

How to create a cell-sized chart?
Tiny charts, called Sparklines, were added to Excel 2010. Look for Sparklines on the Insert tab.
I think I figured it out, the only issue is the UDF resets some chart formatting.

I tried to add the following to the UDF VBA to turn the data labels on:

cht.SeriesCollection(1).ApplyDataLabels Type:=xlDataLabelsShowValue

But this causes the UDF to resolve to #value.

Any ideas, I really just need to get the data labels on and this is good to go.

Thanks
 
Upvote 0
OK i figured the datalabels out using the following line:

cht.SeriesCollection(1).HasDataLabels = True

the labels are there but I cant get them to be one decimal place format, even when using this line:

cht.SeriesCollection(1).DataLabels.NumberFormat = "##.#"

This would be the finishing touc if anyone can help.

Thanks
 
Upvote 0
are you sure your index is okay, or do you only have 1 serie ?
Seriescollection vs fullseriecollection ??? Do you sometimes select in your series ?
Normally your line should work
VBA Code:
Sub DataNumberformat()
     With ActiveSheet.ChartObjects(1).Chart.FullSeriesCollection(1)
          .ApplyDataLabels
          .DataLabels.NumberFormat = "#.###,###"                'change to you desire
     End With
End Sub
bizar, i use dutch reginal settings and recorded & adapted the macro above.
The numberformat has a . for the thousands and a comma als decimal separator.
I check this , that can't be right.
Checked it, apparently the label numberformat follows the regional settings ???
 
Last edited:
Upvote 0
are you sure your index is okay, or do you only have 1 serie ?
Seriescollection vs fullseriecollection ??? Do you sometimes select in your series ?
Normally your line should work
VBA Code:
Sub DataNumberformat()
     With ActiveSheet.ChartObjects(1).Chart.FullSeriesCollection(1)
          .ApplyDataLabels
          .DataLabels.NumberFormat = "#.###,###"                'change to you desire
     End With
End Sub
bizar, i use dutch reginal settings and recorded & adapted the macro above.
The numberformat has a . for the thousands and a comma als decimal separator.
I check this , that can't be right.
There’s only one series.

I need the datalabel number format VBA to work within a UDF per the link in my first post. Do you think that’s the issue?
 
Upvote 0
no, but try your numberformat with a comma instead of a point
 
Upvote 0
no, but try your numberformat with a comma instead of a point
Set cht = Application.Caller.Parent.Parent.Sheets(sheetName) _
.ChartObjects(chartName).Chart


With cht.FullSeriesCollection(1)
.HasDataLabels = True
.ApplyDataLabels
.DataLabels.NumberFormat = "##,#" 'change to you desire
End With


It has no effect, like the number format line is being ignored. .Applydatalabels actually errors the UDF to #value. I need HasDataLabels = TRUE to make the labels even appear.
Is it to do with using the wrong method for the object?
 
Last edited:
Upvote 0
use the macro-recorder and change the numberformat manually to "##,####".
Check what you got.
Are the chartobject (name or index) and the seriescollection-index okay ?
Change in that recorded macro, the numberformat again to "##,#" and run the macro.
Does that work ?
Is the decimal with a comma or a point ?
The macro recorder only records this when I make changes to the numenr format on the chart:

ActiveSheet.Shapes.Range(Array("Chart 21")).Select

This is a waterfall chart which is one of the 'special' charts so perhaps thats the issue?

This code works to make the datalabels appear:

With cht.FullSeriesCollection(1)
.HasDataLabels = True

as soon as I add anything else like .DataLabels.NumberFormat = "##,#", the UDF errors to #Value.
 
Upvote 0

Forum statistics

Threads
1,214,649
Messages
6,120,730
Members
448,987
Latest member
marion_davis

We've detected that you are using an adblocker.

We have a great community of people providing Excel help here, but the hosting costs are enormous. You can help keep this site running by allowing ads on MrExcel.com.
Allow Ads at MrExcel

Which adblocker are you using?

Disable AdBlock

Follow these easy steps to disable AdBlock

1)Click on the icon in the browser’s toolbar.
2)Click on the icon in the browser’s toolbar.
2)Click on the "Pause on this site" option.
Go back

Disable AdBlock Plus

Follow these easy steps to disable AdBlock Plus

1)Click on the icon in the browser’s toolbar.
2)Click on the toggle to disable it for "mrexcel.com".
Go back

Disable uBlock Origin

Follow these easy steps to disable uBlock Origin

1)Click on the icon in the browser’s toolbar.
2)Click on the "Power" button.
3)Click on the "Refresh" button.
Go back

Disable uBlock

Follow these easy steps to disable uBlock

1)Click on the icon in the browser’s toolbar.
2)Click on the "Power" button.
3)Click on the "Refresh" button.
Go back
Back
Top