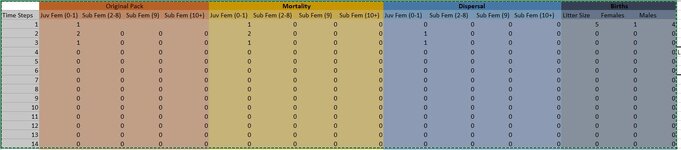
This should be really simple. I have a birth rate, which become Juveniles (column b) for a year, then there is a death rate applied, and they move into been aged to 2 year, this repeats for 8 years, when they become 9 and then again when they become 10 (different death rates applied to nine year olds and 10 year olds). The idea is to see how the population grows.
My challenge is I can't get the calculation in my head, I feel it should be simple but I am getting myself into a tizz over it.
I have not been told, so I assume say a 10% dealth rate applies to the whole of the population in the age group.
any help or ideas would be greatly appreciated
My challenge is I can't get the calculation in my head, I feel it should be simple but I am getting myself into a tizz over it.
I have not been told, so I assume say a 10% dealth rate applies to the whole of the population in the age group.
any help or ideas would be greatly appreciated