I'm updating 5 line charts from calendar year to fiscal year. I updated data first, by hiding the first few months and organizing the data by Fiscal Year (Insert rows, copy - paste to new rows. then updating the 2nd FY). A youtube video said hiding could cause a problem so I deleted the hidden rows.
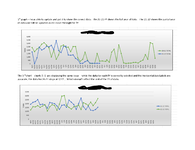
For the first two charts, I was successful - I updated the axis in select data, then updated the 1st and 2nd fiscal year - the chart was a little squirrely at first but I got it to show both years, tied to the new FY
the last three charts I can not get to update. They all show data from 10/3 to 4/17... our FY ends on 9/25/22. the line chart for the 1st fiscal year stops at 4/17. The data is selected, but it doesn't show in the line chart.
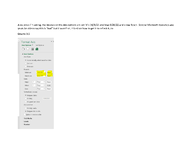
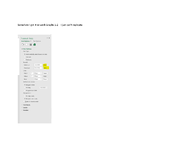
Also after digging into multiple youtube videos I see the bounds on the axis show reset - I can't get them to auto and I'm not finding any resources on this
I'm wondering why the disconnect
For the first two charts, I was successful - I updated the axis in select data, then updated the 1st and 2nd fiscal year - the chart was a little squirrely at first but I got it to show both years, tied to the new FY
the last three charts I can not get to update. They all show data from 10/3 to 4/17... our FY ends on 9/25/22. the line chart for the 1st fiscal year stops at 4/17. The data is selected, but it doesn't show in the line chart.
Also after digging into multiple youtube videos I see the bounds on the axis show reset - I can't get them to auto and I'm not finding any resources on this
I'm wondering why the disconnect