VBA data label if isnot #N/A

Risk

Board Regular
Joined
Jul 27, 2006
Messages
71
Trying to add a data label, "Series Name" to series values which are not "#N/A".

This is what my data series looks like, the Series Name is "At Q3 '04 Prices"
U5lru.jpg


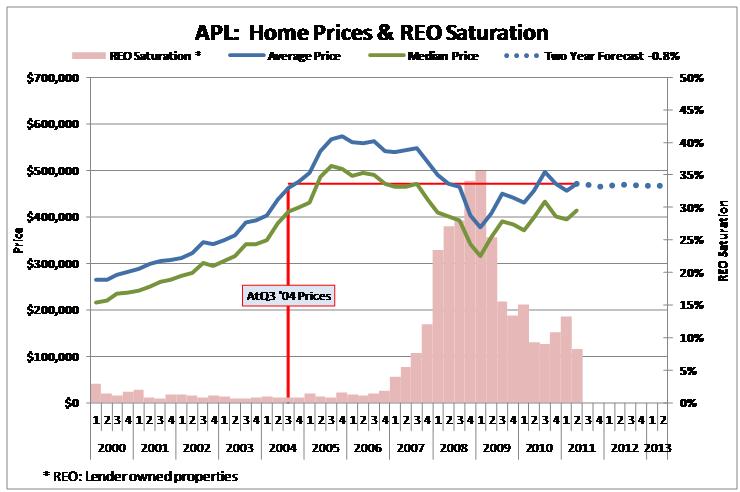
This is what I'm trying to accomplish
BM6Ig.jpg


Add Series Name to data points that are not "#N/A", centered, light blue accent 80%, red boarder.

This is my horrible attempt at the VBA, any ideas on how to do this? Only need it for ActiveChart.SeriesCollection(5)

Code:
Sub Not_NA_Data_Label()
For i = 1 To UBound(ActiveChart.SeriesCollection(5).Values)
 If Values(i) <> "#N/A" Then ApplyDataLabels AutoText:=True, LegendKey:=False, _
            HasLeaderLines:=False, ShowSeriesName:=True, ShowCategoryName:=False, _
            ShowValue:=False, ShowPercentage:=False, ShowBubbleSize:=False
 '''also need to some how add .Position = xlLabelPositionCenter
Next i
 
End If

End Sub
 

Excel Facts

How to total the visible cells?
From the first blank cell below a filtered data set, press Alt+=. Instead of SUM, you will get SUBTOTAL(9,)
I think I solved my own problem

Code:
Sub Series_Labels_Greater_Than_One()

    Dim srs As Series, i As Long, cht As Chart
    
   Set srs = ActiveChart.SeriesCollection(5)
   
    
    On Error Resume Next
        Set cht = ActiveChart
    On Error GoTo 0
    
    If cht Is Nothing Then
        MsgBox "Please select a chart first.", vbInformation, "No Chart Selected"
        
    Else
        srs.ApplyDataLabels AutoText:=True, LegendKey:=False, _
            HasLeaderLines:=False, ShowSeriesName:=True, ShowCategoryName:=False, _
            ShowValue:=False, ShowPercentage:=False, ShowBubbleSize:=False
        
       
            For i = 1 To UBound(srs.Values)
                If srs.Values(i) < 1 Then srs.Points(i).DataLabel.Delete
            Next i
        
    End If
End Sub
 
Upvote 0
This doesn't answer your specific question,s but with a quick glance at your code I noticed you have the positions of Next i and End If swapped in your code. Syntax-wise, it should be this...

Code:
Sub Not_NA_Data_Label()
For i = 1 To UBound(ActiveChart.SeriesCollection(5).Values)
 If Values(i) <> "#N/A" Then ApplyDataLabels AutoText:=True, LegendKey:=False, _
            HasLeaderLines:=False, ShowSeriesName:=True, ShowCategoryName:=False, _
            ShowValue:=False, ShowPercentage:=False, ShowBubbleSize:=False
 '''also need to some how add .Position = xlLabelPositionCenter
[COLOR="Red"]End If[/COLOR]
 
[COLOR="Red"]Next i[/COLOR]

End Sub
 
Upvote 0

Forum statistics

Threads
1,224,518
Messages
6,179,248
Members
452,900
Latest member
LisaGo

We've detected that you are using an adblocker.

We have a great community of people providing Excel help here, but the hosting costs are enormous. You can help keep this site running by allowing ads on MrExcel.com.
Allow Ads at MrExcel

Which adblocker are you using?

Disable AdBlock

Follow these easy steps to disable AdBlock

1)Click on the icon in the browser’s toolbar.
2)Click on the icon in the browser’s toolbar.
2)Click on the "Pause on this site" option.
Go back

Disable AdBlock Plus

Follow these easy steps to disable AdBlock Plus

1)Click on the icon in the browser’s toolbar.
2)Click on the toggle to disable it for "mrexcel.com".
Go back

Disable uBlock Origin

Follow these easy steps to disable uBlock Origin

1)Click on the icon in the browser’s toolbar.
2)Click on the "Power" button.
3)Click on the "Refresh" button.
Go back

Disable uBlock

Follow these easy steps to disable uBlock

1)Click on the icon in the browser’s toolbar.
2)Click on the "Power" button.
3)Click on the "Refresh" button.
Go back
Back
Top