VBA for Chart Label , and axis

sanket_sk

Board Regular
Joined
Dec 27, 2016
Messages
140
Office Version
  1. 365
Platform
  1. Windows
I'm in deep trouble :(
I have created a dashboard that has a lot of pivot charts, these charts are controlled by Slicers.

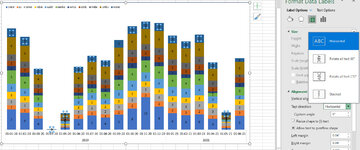
I want the chart label in "Rotate text 270", which I set manually once but when I apply the slicer all the labels go back to horizontal, could you please guide me on how I can keep them in rotated text format.

I am Okay to apply VBA for this.

Also please guide how I can apply/remove the primary vertical major axis and primary major gridlines using VBA
 

Attachments

  • Chart.jpg
    Chart.jpg
    175.7 KB · Views: 16

Excel Facts

Enter current date or time
Ctrl+: enters current time. Ctrl+; enters current date. Use Ctrl+: Ctrl+; Enter for current date & time.

Forum statistics

Threads
1,214,605
Messages
6,120,473
Members
448,967
Latest member
visheshkotha

We've detected that you are using an adblocker.

We have a great community of people providing Excel help here, but the hosting costs are enormous. You can help keep this site running by allowing ads on MrExcel.com.
Allow Ads at MrExcel

Which adblocker are you using?

Disable AdBlock

Follow these easy steps to disable AdBlock

1)Click on the icon in the browser’s toolbar.
2)Click on the icon in the browser’s toolbar.
2)Click on the "Pause on this site" option.
Go back

Disable AdBlock Plus

Follow these easy steps to disable AdBlock Plus

1)Click on the icon in the browser’s toolbar.
2)Click on the toggle to disable it for "mrexcel.com".
Go back

Disable uBlock Origin

Follow these easy steps to disable uBlock Origin

1)Click on the icon in the browser’s toolbar.
2)Click on the "Power" button.
3)Click on the "Refresh" button.
Go back

Disable uBlock

Follow these easy steps to disable uBlock

1)Click on the icon in the browser’s toolbar.
2)Click on the "Power" button.
3)Click on the "Refresh" button.
Go back
Back
Top