VBA to Create ScatterSmooth Chart

lbradbury

New Member
Joined
May 14, 2020
Messages
46
Office Version
  1. 365
Platform
  1. Windows
Hello,

I'm attempting to create a VBA that takes a plot of data and insert a chart based on this range. The chart would like it to insert is a Scatter Smooth No Markers Chart. However, when I attempt to run the script I receive a chart that has just a single data point. I can then change the style of this VBA generated chart to the style I requested, and it is fine.

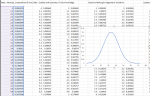
Below is the script I'm using, and attached are snipits of the chart generated. Chart wanted. I have been messing with this over and over, and now I'm to the point where I don't think I would see the issue.


Sub CreateChart()


Range("A5:B100").Select
ActiveSheet.Shapes.AddChart2(240, xlXYScatterSmooth).Select
ActiveChart.SetSourceData Source:=Range("DataHelperSheet!$A$5:$B$100")
ActiveChart.ChartType = xlXYScatterSmoothNoMarkers
End Sub

Thank you for the help.
 

Attachments

  • Chart Generated.PNG
    Chart Generated.PNG
    61.6 KB · Views: 87
  • Chart Wanted.PNG
    Chart Wanted.PNG
    72.2 KB · Views: 87

Excel Facts

Save Often
If you start asking yourself if now is a good time to save your Excel workbook, the answer is Yes
See if this works (not tested)

VBA Code:
Sub CreateChart()
    Dim Sh As Shape, rng As Range

    With ActiveSheet
        Set rng = .Range("A5:B100")
        'adjust position and size as needed
        Set Sh = .Shapes.AddChart2(Style:=240, XlChartType:=xlXYScatterSmoothNoMarkers, Left:=300, Top:=200, Width:=400, Height:=150)
    End With

    Sh.Chart.SetSourceData Source:=rng

    With Sh.Chart
        .Axes(xlCategory, xlPrimary).HasTitle = True
        .Axes(xlCategory, xlPrimary).AxisTitle.Text = "X-Axis"
        .Axes(xlValue, xlPrimary).HasTitle = True
        .Axes(xlValue, xlPrimary).AxisTitle.Text = "Y-Axis"
        .ChartTitle.Caption = "My Chart"
    End With
End Sub
 
Upvote 0
@rlv01 I'm encountering the same issue where the bell curve doesn't generate, it will when I change the style of the chart. When I change the style chart the axis limits change.
 
Upvote 0
Using an empty worksheet, run this tested code without modification. It should produce a chart as shown without the problem you are experiencing. Assuming it does, then it suggests that we look closer at how you are defining your chart data.

VBA Code:
Sub ChartCreationTest()
    Dim rng As Range
    Dim I As Long
    Dim X As Double
    Dim Sh As Shape

    Select Case MsgBox("This test code is meant to run in an empty worksheet. It will clear all data on the ActiveSheet (" & ActiveSheet.Name & ")." & vbCrLf _
                     & "" & vbCrLf _
                     & "Continue?", vbYesNo Or vbQuestion Or vbDefaultButton2, Application.Name)
    Case vbNo
        Exit Sub
    End Select

    With ActiveSheet
        .Cells.Clear

        'delete any existing charts
        For Each Sh In .Shapes
            Sh.Delete
        Next Sh

        'add some chart data (which approximates the data in your post).
        For I = 3 To 650
            Select Case I
            Case 3
                X = 2
            Case Else
                X = X + 0.1
            End Select
            .Cells(I, 1).Value = X
            .Cells(I, 2).Value = Application.WorksheetFunction.NormDist(X, 35, 10, False)
        Next I

        'create a new chart using the new data

        Set rng = .Range("A3:B" & .Range("A" & .Rows.Count).End(xlUp).Row)
        'adjust position and size as needed
        Set Sh = .Shapes.AddChart2(Style:=240, XlChartType:=xlXYScatterSmoothNoMarkers, Left:=300, Top:=100, Width:=400, Height:=350)

        Sh.Chart.SetSourceData Source:=rng

        With Sh.Chart
            .Axes(xlCategory, xlPrimary).HasTitle = True
            .Axes(xlCategory, xlPrimary).AxisTitle.Text = "X-Axis"
            .Axes(xlValue, xlPrimary).HasTitle = True
            .Axes(xlValue, xlPrimary).AxisTitle.Text = "Y-Axis"
            .ChartTitle.Caption = "My Chart"
            .SeriesCollection(1).Name = "Sample Data"
            .HasLegend = True
        End With
        .Range("A1").Select
    End With
End Sub

1590687326996.png
 
Upvote 0
@rlv01 I figured out the chart data range issue. One last question, I want to stack this chart generation VBA to compile the same type of charts for multiple sets of data. Any suggestions on completing that?
 
Upvote 0
Not sure what you mean by "stack" but, the basic code can be used to create multiple charts.
 
Upvote 0
Using an empty worksheet, run this tested code without modification. It should produce a chart as shown without the problem you are experiencing. Assuming it does, then it suggests that we look closer at how you are defining your chart data.

VBA Code:
Sub ChartCreationTest()
    Dim rng As Range
    Dim I As Long
    Dim X As Double
    Dim Sh As Shape

    Select Case MsgBox("This test code is meant to run in an empty worksheet. It will clear all data on the ActiveSheet (" & ActiveSheet.Name & ")." & vbCrLf _
                     & "" & vbCrLf _
                     & "Continue?", vbYesNo Or vbQuestion Or vbDefaultButton2, Application.Name)
    Case vbNo
        Exit Sub
    End Select

    With ActiveSheet
        .Cells.Clear

        'delete any existing charts
        For Each Sh In .Shapes
            Sh.Delete
        Next Sh

        'add some chart data (which approximates the data in your post).
        For I = 3 To 650
            Select Case I
            Case 3
                X = 2
            Case Else
                X = X + 0.1
            End Select
            .Cells(I, 1).Value = X
            .Cells(I, 2).Value = Application.WorksheetFunction.NormDist(X, 35, 10, False)
        Next I

        'create a new chart using the new data

        Set rng = .Range("A3:B" & .Range("A" & .Rows.Count).End(xlUp).Row)
        'adjust position and size as needed
        Set Sh = .Shapes.AddChart2(Style:=240, XlChartType:=xlXYScatterSmoothNoMarkers, Left:=300, Top:=100, Width:=400, Height:=350)

        Sh.Chart.SetSourceData Source:=rng

        With Sh.Chart
            .Axes(xlCategory, xlPrimary).HasTitle = True
            .Axes(xlCategory, xlPrimary).AxisTitle.Text = "X-Axis"
            .Axes(xlValue, xlPrimary).HasTitle = True
            .Axes(xlValue, xlPrimary).AxisTitle.Text = "Y-Axis"
            .ChartTitle.Caption = "My Chart"
            .SeriesCollection(1).Name = "Sample Data"
            .HasLegend = True
        End With
        .Range("A1").Select
    End With
End Sub

View attachment 14973
Hi! this was really helpful. How can I delete only the charts in the sheet? Your code is for deleting all the shapes in it. Thanks!
 
Upvote 0
It's probably not a good idea to reopen a 3 year old thread.

The basic method is this
VBA Code:
    Dim ChO As ChartObject
    With ActiveSheet
        For Each ChO In .ChartObjects
            ChO.Delete
        Next ChO
    End With
 
Upvote 0

Forum statistics

Threads
1,214,641
Messages
6,120,691
Members
448,978
Latest member
rrauni

We've detected that you are using an adblocker.

We have a great community of people providing Excel help here, but the hosting costs are enormous. You can help keep this site running by allowing ads on MrExcel.com.
Allow Ads at MrExcel

Which adblocker are you using?

Disable AdBlock

Follow these easy steps to disable AdBlock

1)Click on the icon in the browser’s toolbar.
2)Click on the icon in the browser’s toolbar.
2)Click on the "Pause on this site" option.
Go back

Disable AdBlock Plus

Follow these easy steps to disable AdBlock Plus

1)Click on the icon in the browser’s toolbar.
2)Click on the toggle to disable it for "mrexcel.com".
Go back

Disable uBlock Origin

Follow these easy steps to disable uBlock Origin

1)Click on the icon in the browser’s toolbar.
2)Click on the "Power" button.
3)Click on the "Refresh" button.
Go back

Disable uBlock

Follow these easy steps to disable uBlock

1)Click on the icon in the browser’s toolbar.
2)Click on the "Power" button.
3)Click on the "Refresh" button.
Go back
Back
Top