waterfall stacked column charts

Bayesatthemoon

New Member
Joined
Oct 21, 2015
Messages
7
Hi everyone, hope you're all well and healthy.

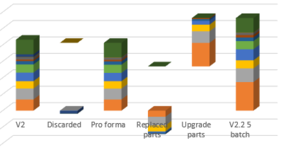
I want to show the change in the cost of building my V2.2 product relative to my V2 product. The change is due to some parts being scrapped, some parts no longer being used and new parts being added.

A plain waterfall would be easy. It would show cost of V2 as a value, then reduction due parts scrapped as a down bar, another down bar from parts no longer used, an up bar from parts being added and finishing up with the cost of my V2.2

But my product is made of many different types of components: metal, plastic, pcb, motor etc. So I would like to have each bar stacked according to the different components. Can you please help me do that?
 

Excel Facts

Workdays for a market open Mon, Wed, Friday?
Yes! Use "0101011" for the weekend argument in NETWORKDAYS.INTL or WORKDAY.INTL. The 7 digits start on Monday. 1 means it is a weekend.
I assume you're familiar with building a waterfall chart. If not, check out my tutorial Excel Waterfall Charts (Bridge Charts).

Here's my take. The data is shown below. I'm assuming three up bars (A1-A3) and three down bars (B1-B3), but you can do however many you need.

Select the data, insert a stacked column chart, which is plotted by rows (top left). Switch rows and columns (top center). Do some formatting: Make the blank series blank (no fill). I colored the up bars blue, darkest at the bottom to hint that it's going up, and the down bars orange, darkest at the bottom to hint that it's going down. Also, gap width is 50%.

If you want lines joining adjacent columns, there is some data for XY Scatter points at the top right. The first point is between V2 and Up, or between categories 1 and 2, so X=1.5; same logic for the other two points.

Copy this new data, select the chart, paste special as new series, first row and first column boxes checked; the new series is stacked on top (bottom left). Right click on the added series, choose Change Series Chart Type, find the last series n the list and change it to XY Scatter, and uncheck the secondary axis box (bottom center). Add error bars to this last series, delete the vertical error bars, and format the horizontal ones: no cap, value = 5/6 by inspection, and it depends on the gap width (bottom right).

Stacked Bar Up Down.png
 
Upvote 0
Solution
John, a very, very belated thanks. We've been flat out with COVID19 and driving the business. Your approach worked beautifully except that the down values ended up starting below the X axis as per the screenshots. I took a screenshot of the negatives and pasted them on the chart, which is cheating but worked for the meeting. I feel guilty though and should learn how to do it properly. But thanks again in any case, it's so cool that you take the time to help people with these issues.
 

Attachments

  • John Peltier reply.PNG
    John Peltier reply.PNG
    8.9 KB · Views: 39
Upvote 0

Forum statistics

Threads
1,214,918
Messages
6,122,249
Members
449,075
Latest member
staticfluids

We've detected that you are using an adblocker.

We have a great community of people providing Excel help here, but the hosting costs are enormous. You can help keep this site running by allowing ads on MrExcel.com.
Allow Ads at MrExcel

Which adblocker are you using?

Disable AdBlock

Follow these easy steps to disable AdBlock

1)Click on the icon in the browser’s toolbar.
2)Click on the icon in the browser’s toolbar.
2)Click on the "Pause on this site" option.
Go back

Disable AdBlock Plus

Follow these easy steps to disable AdBlock Plus

1)Click on the icon in the browser’s toolbar.
2)Click on the toggle to disable it for "mrexcel.com".
Go back

Disable uBlock Origin

Follow these easy steps to disable uBlock Origin

1)Click on the icon in the browser’s toolbar.
2)Click on the "Power" button.
3)Click on the "Refresh" button.
Go back

Disable uBlock

Follow these easy steps to disable uBlock

1)Click on the icon in the browser’s toolbar.
2)Click on the "Power" button.
3)Click on the "Refresh" button.
Go back
Back
Top