
Excel 2020: Count Distinct
June 18, 2020 - by Bill Jelen

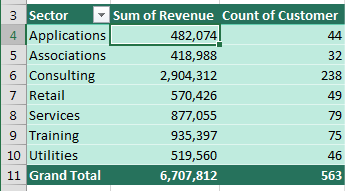
To see an annoyance with pivot tables, drag the Customer column from the Data table to the VALUES area. The field says Count of Customer, but it is really a count of the invoices belong to each sector. What if you really want to see how many unique customers belong to each sector?
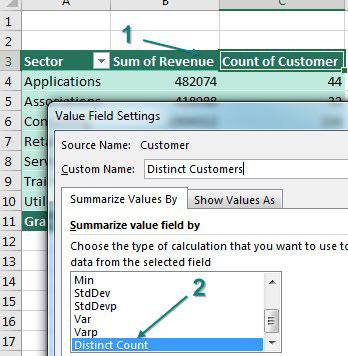
The trick is to build your pivot table using the Data Model. Double-click the Count of Customer heading. At first, the Summarize Values By offers choices such as Sum, Average, and Count. Scroll down to the bottom. Because the pivot table is based on the Data Model, you now have Distinct Count.
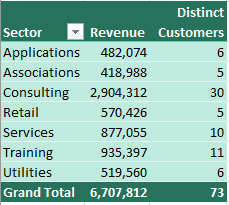
After you select Distinct Count, the pivot table shows a distinct count of customers for each sector. This was very hard to do in regular pivot tables.
Note
If you don't have Excel 2013 or newer and do not have the Data Model (for example, you might be using Excel for Mac), there are other ways to get a distinct count. Read Roger Govier's article here.
Thanks to Colin Michael and Alejandro Quiceno for suggesting Power Pivot.
Title Photo: Monika Grabkowska at Unsplash.com
This article is an excerpt from MrExcel 2020 - Seeing Excel Clearly.