
Excel 2020: Create a Data Table from a Blank Cell
November 04, 2020 - by Bill Jelen

Note
Note: If you took a class on financial modeling in college, you likely used a textbook written by Professor Simon Benninga. He showed me this cool Excel trick.
Simon Benninga tells a story of a game called Penny Pitching. You and another student would each flip a penny. If you get one head and one tail, you win the penny. If the coins match (heads/heads or tails/tails), the other student gets the penny.
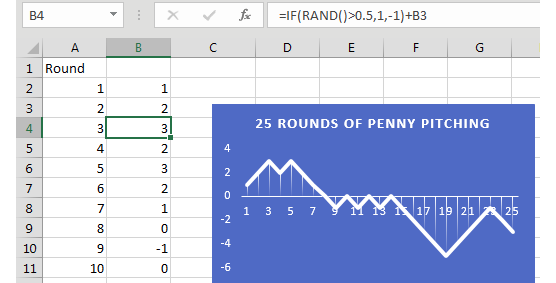
It is simple to model this game in Excel. If RAND()>.5, you win a penny. Otherwise, you lose a penny. Do that for 25 rows and chart the result. Press F9 to play 25 more rounds.
This is known as a Random Walk Down Wall Street. Simon would point out a result like the one below, where a hot young stock analyst is on fire with a series of wins, but then a series of losses wipe out the gain. This is why they say that past results are not a guarantee of future returns.
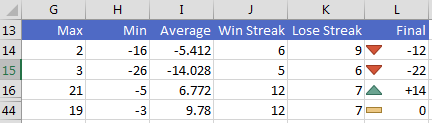
Instead of 25 trials, extend your table in columns A and B to run 250 trials. This would be like playing one round of penny pitching every work day for a year. Build a row of statistics about that year, as shown below.

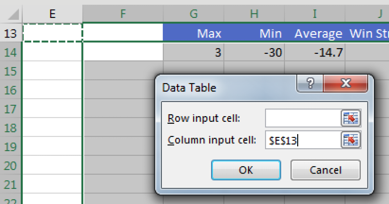
Create an odd data table where the blank cell in column F is the corner cell. Leave Row Input Cell blank. Specify any blank cell for Column Input Cell.
When you create the table, Excel runs the 250 coin flips, once per row. This 30-row table models the entire career of a stock analyst. Every time you press F9, Excel runs the 250-row model for each of 30 years. You can watch an entire 30-year career be modeled with the simple press of F9.
Thanks to Professor Simon Benninga for showing me this technique.
Title Photo: rawpixel.com / Unsplash
This article is an excerpt from MrExcel 2020 - Seeing Excel Clearly.