
Excel 2020: Geography & Stock Data Types in Excel
September 07, 2020 - by Bill Jelen

In the past, Excel did not really handle data types. Yes, you could format some cells as Date or Text, but the new data types provide a whole new entry point for new data types now and in the future.
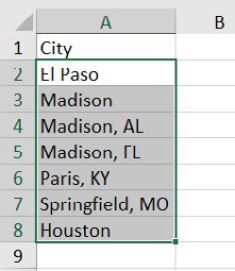
Start with a column of City names. For large cities like Madison Wisconsin, you can just put Madison. For smaller towns, you might enter Madison, FL.
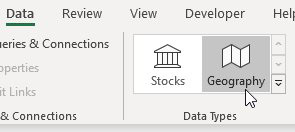
From the Data tab, select Geography.
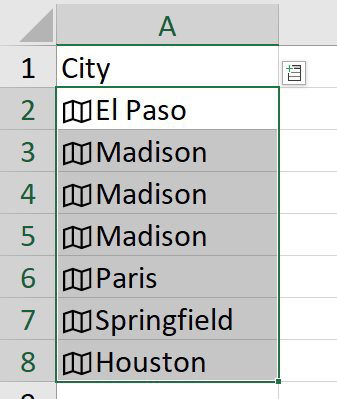
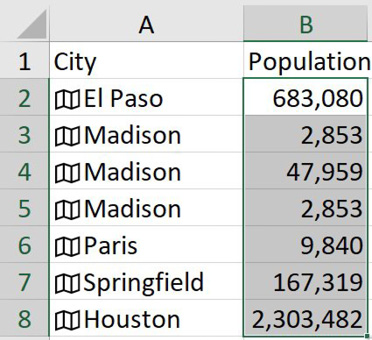
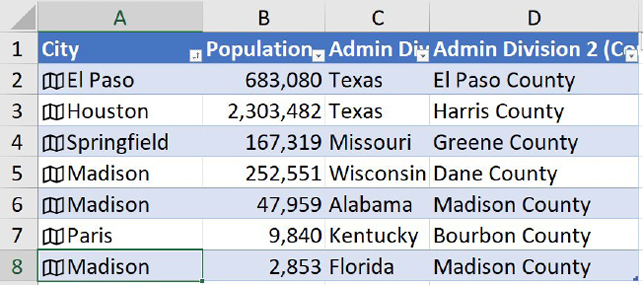
Excel searches the Internet and finds a city for each cell. A folded map appears next to each cell. Notice that you lose the state that was in the original cell.
Click on the Map icon and a data card appears with information about the city.
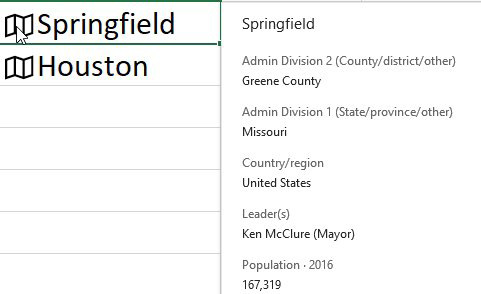
The best part: for any data in the card, you can use a formula to pull that data into a cell. Enter =A2. Population in cell B2 and Excel returns the population of El Paso. Double click the Fill Handle in B2 and Excel returns the population for each city.
Caution
These new formulas might return a #FIELD! error. This means, Excel, or more correctly Bing, does not know the answer to this yet, but it may do so at some time in the future. It is not an error with the formula or the table, just a lack of knowledge currently.
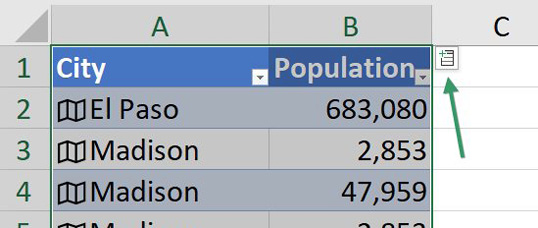
The Geography and Stock data types have extra features if you format as a table using Ctrl+T.
A new Add Data icon appears to the right of the heading. Use this drop-down menu to add fields without having to type the formulas. Clicking the icon will enter the formula for you.
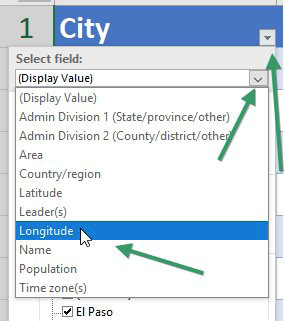
You can also sort the data by any field, even if it is not in the Excel grid. Open the drop-down menu for the City column. Use the new Display Field drop-down to choose Longitude.
With Longitude selected, choose sort Smallest to Largest.
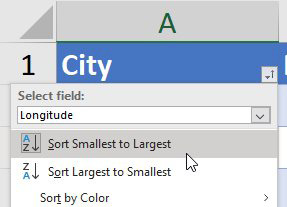
The result: data is sorted west to east.
Title Photo: Benjamin Blättler at Unsplash.com
This article is an excerpt from MrExcel 2020 - Seeing Excel Clearly.