
Excel 2020: Use Ctrl+T with VLOOKUP and Charts
May 21, 2020 - by Bill Jelen

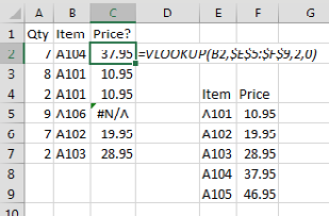
In this figure, the VLOOKUP table is in E5:F9. Item A106 is missing from the table, and the VLOOKUP is returning #N/A. Conventional wisdom says to add A106 to the middle of your VLOOKUP table so you don’t have to rewrite the formula.
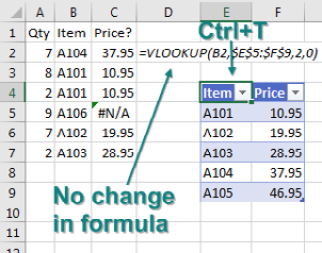
Instead, use Ctrl+T to format the lookup table. Note that the formula is still pointing to E5:F9; nothing changes in the formula.
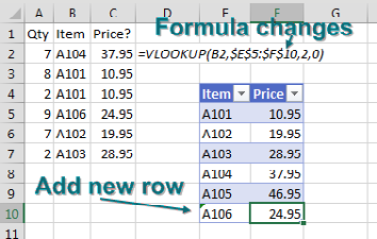
But when you type a new row below the table, it becomes part of the table, and the VLOOKUP formula automatically updates to reflect the new range.
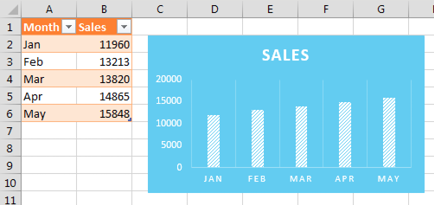
The same thing happens with charts. The chart below is based on A1:B5, which is not a table.
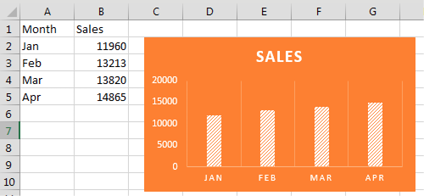
Format A1:B5 as a table by pressing Ctrl+T. Add a new row. The row is automatically added to the chart, as shown on the right.
It is fairly cool that you can use Ctrl+T after setting up the pivot table, VLOOKUP, or chart, and Excel still makes the range expand.
When I asked readers to vote for their favorite tips, tables were popular. Thanks to Peter Albert, Snorre Eikeland, Nancy Federice, Colin Michael, James E. Moede, Keyur Patel, and Paul Peton for suggesting this feature. Four readers suggested using OFFSET to create expanding ranges for dynamic charts: Charley Baak, Don Knowles, Francis Logan, and Cecelia Rieb. Tables now do the same thing in most cases.
Title Photo: Steve Johnson at Unsplash.com
This article is an excerpt from MrExcel 2020 - Seeing Excel Clearly.