
I Use Excel's Trendline Feature to Prevent Procrastination
March 24, 2018 - by Bill Jelen

Excel 2019 is coming later this year. That means I get to update 3 books this year. Writing books requires a certain tenacity - you have to work every day for several months to make progress. Here is how I use the Excel trendline function to keep me on track.
To start, I figure out how many items I have to complete. Pages for me. Perhaps Accounting Reports for you. Let's say I have to complete 200 pages between now and April 30.
I enter each day from today until the deadline. I use a function to count each weekday as one day. I count Saturdays as a half day. I count Sundays as zero days. The formula in B4 shows that I have 29 equivalent days to get 200 pages done. That means I need to complete 6.89 pages a day.
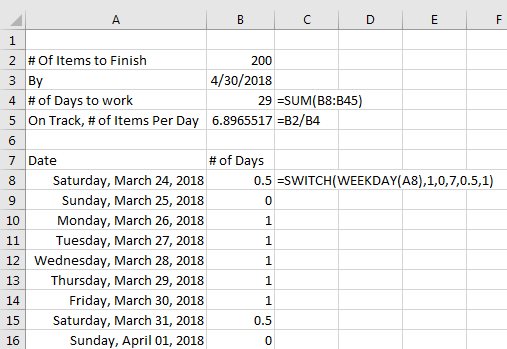
Build a table showing:
- The goal is 200. Copy this down to all rows.
- How many pages should be written each day.
- The accumulated total of how many pages should be written. I call this "Track" as in "Where I need to be if I am on track"
- Have a column where you fill in how many items you actually completed each day
- Calculate the accumulated total of Actually Done for the days where you have an entry. Use an IF function to make all future points be NA().
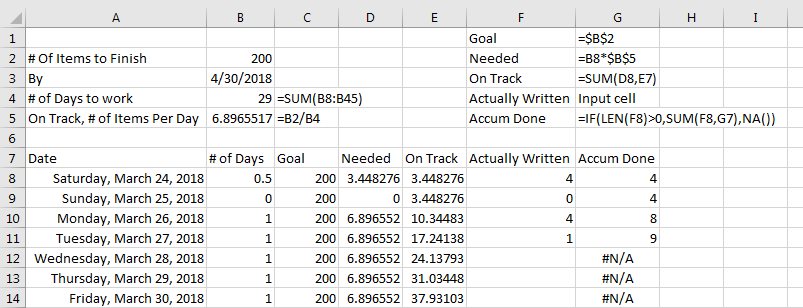
The table does not give me enough incentive. I add four columns to the right that include Date, Goal, Track, and Actual. Select that range and insert a line chart. I change the Shape Outline color for each series. Goal is Green, Track is Grey, Actual is Blue.
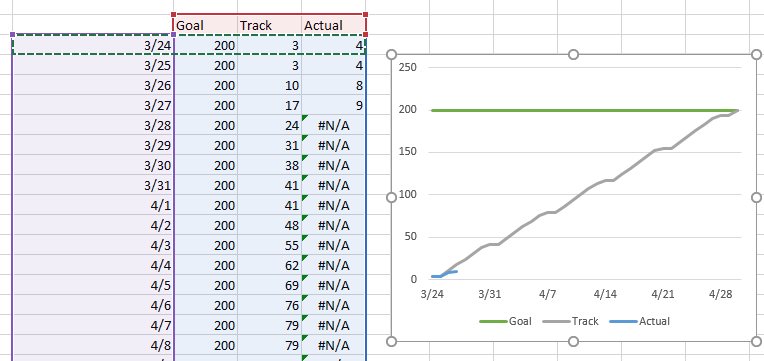
After you have entered the Actual data for 2 or more days, follow these steps to add a trend line:
- Click on the line for Actual in the chart.
- Right-click and choose Add Trendline. The trendline will default to Linear which is fine.
- Format the trendline as red and dotted.
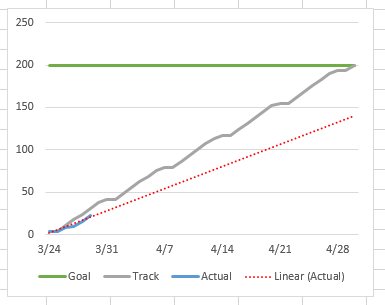
The red trendline is my motivator. As shown below, I got off to a slow start. Excel is telling me that if I continue at the same pace, I will have about 70 pages done by the deadline, very short of the 200 goal.
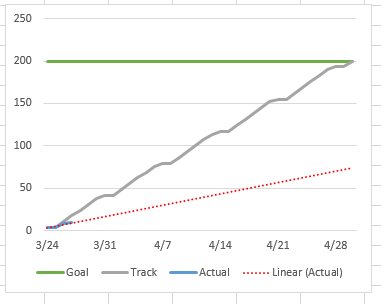
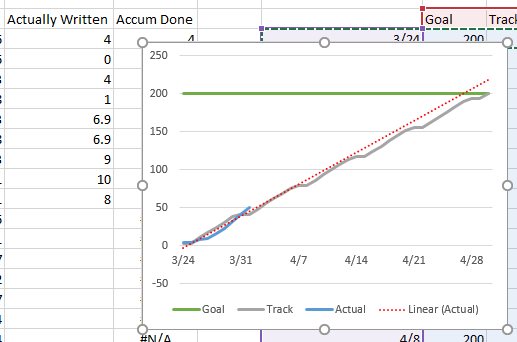
I confess that I give the red trendline a personality. But the red trendline is a cruel taskmaster. Let's say I put together two days where I write the required 6.89 days. The dotted red line is not impressed. The red line still says I am going to miss the deadline by 25%.
To get the red line to react, I need to put together several days of above-normal performance.
The red trendline is how I get any large project done.
Every Saturday, an admission of guilt. I will reveal my bad habits in Excel and discuss why you should do what I say instead of do what I do.
Excel Thought Of the Day
I've asked my Excel Master friends for their advice about Excel. Today's thought to ponder:
"Applicants that say they’re an “expert” in Excel on your resume will lie about other things too!"
Title Photo: Steinar Engeland / Unsplash