
Sorting the Line Items
February 25, 2020 - by Bill Jelen
Note
This is one of a series of articles detailing solutions sent in for the Podcast 2316 challenge.
One of the problems with my solution is that the final sequence of the categories did not necessarily match the original sequence of the columns. I realized this at the very end of my video, and since it was not particularly important, I did not worry about it.
However, Josh Johnson sent in a solution that handled it. When Josh said he used an Index column, I assumed it was like the Index and Modulo in Power Query: Number Groups of Records as 1 through 5 repeatedly. But Josh’s use was completely different.
Note: Excel MVP John MacDougall also used this method, but he concatenated the index column to the end of the category description. See John’s video here: https://www.youtube.com/watch?v=Dqmb6SEJDXI and read more about his code here: Excel MVPs Attack the Data Cleansing Problem in Power Query.
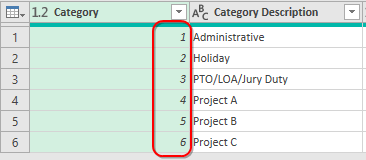
Early in the process, when Josh still only had six records, he added an index starting at 1. Josh clicked in the formula bar and renamed the Index column as Category.
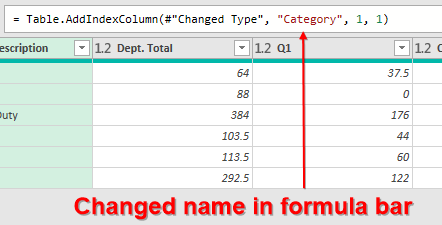
The Category column was the new last column. He used Move, to Beginning to move it to be first:
After this, a lot of other steps happen. They are steps that are innovative but have been mostly covered in the other articles so far. After many such steps, I was starting to think that the Category numbers 1 to 6 were just a mistake. I thought that possibly Josh was going to delete them without using them.
Josh Unpivots, then conditional column, then fill down, then pivots, adds the total. He never seems to use that Category column. After many steps, he is here:
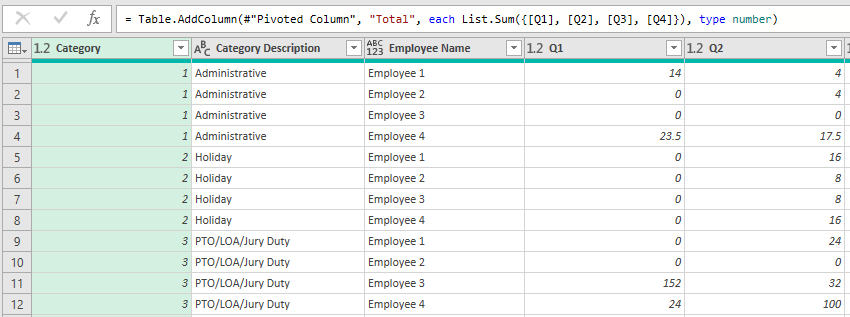
But then in the final steps, Josh sorts the data by Employee Name then Category!
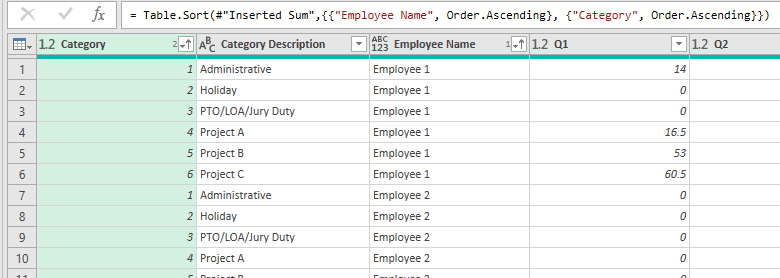
At this point, he can delete the Category column. The final difference: PTO comes before Project A, just like it had in the original columns. It is a nice touch.
I will also point out that Josh sent in a video of him going through these steps. Kudos to Josh for using keyboard shortcuts inside of Power Query!
Here is Josh’s code:
let
    Source = Excel.CurrentWorkbook(){[Name="UglyData"]}[Content],
    #"Promoted Headers" = Table.PromoteHeaders(Source, [PromoteAllScalars=true]),
    #"Changed Type" = Table.TransformColumnTypes(#"Promoted Headers",{{"Category Description", type text}, {"Dept. Total", type number}, {"Q1", type number}, {"Q2", type number}, {"Q3", type number}, {"Q4", Int64.Type}, {"Employee 1", type number}, {"Q1_1", type number}, {"Q2_2", type number}, {"Q3_3", Int64.Type}, {"Q4_4", Int64.Type}, {"Employee 2", Int64.Type}, {"Q1_5", Int64.Type}, {"Q2_6", Int64.Type}, {"Q3_7", Int64.Type}, {"Q4_8", Int64.Type}, {"Employee 3", Int64.Type}, {"Q1_9", Int64.Type}, {"Q2_10", Int64.Type}, {"Q3_11", Int64.Type}, {"Q4_12", Int64.Type}, {"Employee 4", type number}, {"Q1_13", type number}, {"Q2_14", type number}, {"Q3_15", type number}, {"Q4_16", Int64.Type}}),
    #"Added Index" = Table.AddIndexColumn(#"Changed Type", "Category", 1, 1),
    #"Reordered Columns" = Table.ReorderColumns(#"Added Index",{"Category", "Category Description", "Dept. Total", "Q1", "Q2", "Q3", "Q4", "Employee 1", "Q1_1", "Q2_2", "Q3_3", "Q4_4", "Employee 2", "Q1_5", "Q2_6", "Q3_7", "Q4_8", "Employee 3", "Q1_9", "Q2_10", "Q3_11", "Q4_12", "Employee 4", "Q1_13", "Q2_14", "Q3_15", "Q4_16"}),
    #"Unpivoted Other Columns" = Table.UnpivotOtherColumns(#"Reordered Columns", {"Category", "Category Description"}, "Attribute", "Value"),
    #"Extracted Text Before Delimiter" = Table.TransformColumns(#"Unpivoted Other Columns", {{"Attribute", each Text.BeforeDelimiter(_, "_"), type text}}),
    #"Added Conditional Column" = Table.AddColumn(#"Extracted Text Before Delimiter", "Employee Name", each if not Text.StartsWith([Attribute], "Q") then [Attribute] else null),
    #"Filled Down" = Table.FillDown(#"Added Conditional Column",{"Employee Name"}),
    #"Filtered Rows" = Table.SelectRows(#"Filled Down", each ([Attribute] = "Q1" or [Attribute] = "Q2" or [Attribute] = "Q3" or [Attribute] = "Q4") and ([Employee Name] <> "Dept. Total")),
    #"Pivoted Column" = Table.Pivot(#"Filtered Rows", List.Distinct(#"Filtered Rows"[Attribute]), "Attribute", "Value", List.Sum),
    #"Inserted Sum" = Table.AddColumn(#"Pivoted Column", "Total", each List.Sum({[Q1], [Q2], [Q3], [Q4]}), type number),
    #"Sorted Rows" = Table.Sort(#"Inserted Sum",{{"Employee Name", Order.Ascending}, {"Category", Order.Ascending}}),
    #"Removed Columns" = Table.RemoveColumns(#"Sorted Rows",{"Category"})
in
    #"Removed Columns"
Return to the main page for the Podcast 2316 challenge.
Read the next article in this series: Excel MVPs Attack the Data Cleansing Problem in Power Query.