
What-If with Data Table
September 25, 2017 - by Bill Jelen

Excel What-If Analysis offers a Data Table. This is a bad name. It should be called Sensitivity Analysis. It is cool. Read about it here.
Goal Seek lets you find the set of inputs that lead to a particular result. Sometimes, you want to see many different results from various combinations of inputs. Provided that you have only two input cells to change, the data table provides a fast way to compare alternatives.
Using the loan payment example, say that you want to calculate the price for a variety of principal balances and for a variety of terms.
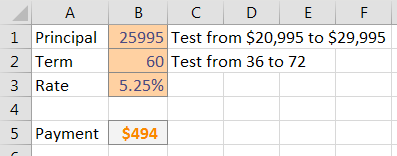
Make sure that the formula you want to model is in the top-left corner of a range. Put various values for one variable down the left column and various values for another variable across the top.
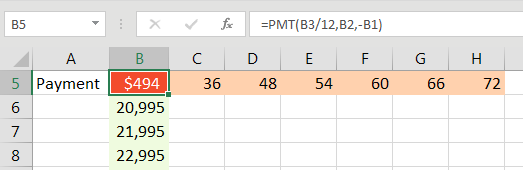
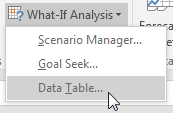
From the Data tab, select What-If Analysis, data table.
You have values along the top row of the input table. You want Excel to plug those values into a certain input cell. Specify that input cell as the Row Input Cell.
You have values along the left column. You want those plugged into another input cell. Specify that cell as the Column Input Cell.
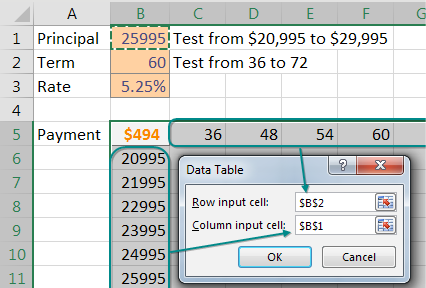
When you click OK, Excel will repeat the formula in the top-left column for all combinations of the top row and left column. In the image below, you see 60 different loan payments based on various results.
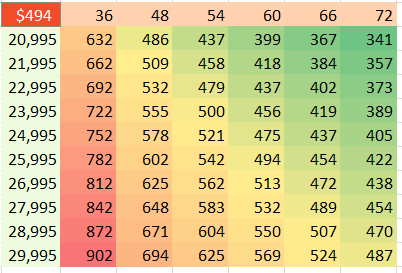
Note that I formatted the table results to have no decimals and used Home, Conditional Formatting, Color Scale to add the red/yellow/green shading.
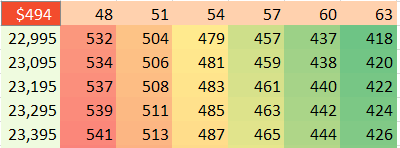
Here is the great part: This table is “live.” If you change the input cells along the left column or top row, the values in the table will recalculate. Below, the values along the left are focused on the $23K to $24K range.
Thanks to Owen W. Green for suggesting tables.
Watch Video
- Three what-if tools in Excel
- Yesterday - Goal Seek
- Today - a Data Table
- Great for two-variable problems
- Trivia: the TABLE array function can not be manually entered - it will not work
- Use a Color Scale to color the answers
- What if you have 3 variables to change? Scenarios? No! Copy worksheet
- Tables are slow to calculate: calculation mode for All Except Tables
- Thanks to Owen W. Green for suggesting this tip
Video Transcript
Learn Excel from MrExcel podcast, episode 2034 - What-Ifs with a Data Table!
I am podcasting this entire book, click the “i” in the top-right hand corner to get to the playlist!
Today we're going to talk about the second tool under What-If Analysis, yesterday we talked about Goal Seek, today we're going to cover a Data Table. So we have this nice little model here, this is a small model, 3 input cells, one formula. But this model could be hundreds of input cells, thousands of rows, as long as it comes down to one final answer, and we want to model this answer for several different values of 2-3(?) input cells. For example, maybe we're interested in looking at different cars, so anywhere from 20000 on up, so I'll put in 20 and 21000 there, grab the fill handle and drag, take that down to 28000. Across the top we're looking at different terms, so a 36-month loan, 42-month loan, 48-month loan, 54, 60, 66, and even 72.
Alright now, this next step is completely optional, but it really helps me to think about this, I always change the colors of the values along the top and the values along the left. And the really important thing here is that that corner cell, that all-important corner cell, has to be the answer that we're trying to model, alright. So you have to start selecting from that corner cell with the answer, and then select all of the rows and all of the columns. So we go into Data, What-if Analysis, and a Data Table, and it's asking for two things here, and here's how you’d think about it. It says there's a whole bunch of different items along the top row in the table, I want to take those items, one at a time, and plug them into the model, where should we input? So these items, these are terms, they should go into the cell B2. And then, there's a whole bunch of items along the left-hand column, we want to take those, one at a time, and plug them into B1, like that, alright and we click OK, BAM, it runs this model over and over and over.
Now just a little bit of cleanup here, I always go in and do Home, and probably 0 decimal places, like that. And maybe a little Conditional Formatting, Color Scales, and let's go with red numbers for large and green numbers for small, just to kind of give me a, you know, way to track this visually. Now it looks like if we're shooting for $425, we're kind of, you know, at this spot or this spot, or you know, maybe here, we'll all get us close to $425. So I can see what are the various odds, our various combinations are, to get us to those values.
Now a couple things, this part inside of here, is actually a big array formula, so =TABLE(B2,B1), the row and column input. This is curious, you are not allowed to type this, you can only create this using Data, What-If Analysis, you have to use that dialog box. If you try and type that formula, press Ctrl+Shift+Enter, it will not work, right? So, it's a function in Excel, but if you're smart enough to type it, too bad, it's not going to work, but it does constantly recalculate. So if we determine that we're only looking at terms from 48, and we want to look in groups of 3 or something like that, so as I change these numbers, all of that is calculating. In this case, it's only doing one formula for each, but imagine if we were doing a 100 formulas, this gets slowed down dramatically. So out here under Formulas, there's actually an option Calculation Options, Automatic or Manual, there's a third one that says “Yeah, recalculate everything except for the Data Tables, don't keep recalculating the data table.” Because this can be a huge drag on calculation times.
Alright now, data tables are awesome when you have two variables to change, but we have three variables to change. What if there were different interest rates, do I recommend going to the Scenario Manager? NO, I NEVER recommend going to the Scenario Manager! In this case we have 9x7, that's 63 different scenarios that we calculated here, to create 63 different Scenario Manager scenarios would take 2 hours, it's horrible. I don't cover this in the “MrExcel XL” book, because it's the 40 best tips. This is probably in my “Power Excel” book with 567 Excel mysteries solved, but I'm sure that I complained about how miserable it is to use, you won't be seeing me do the Scenario Manager here. If we really had to do this for several different rates, the best thing to do is just Ctrl-drag, take this sheet, Ctrl-drag, Ctrl-drag, Ctrl-drag, and then change the rates on each sheet. So if we could get a 5% or 4.75% or something like that and so on, right, there's no easy way to set that up for 3 variables in the Scenario Manager. Alright, “40 Greatest Excel Tips of All Time”, all in this book, you can buy the book, click that “i” on the top-right hand corner.
Episode recap from today: There are three What-If tools in Excel, yesterday we talked about Goal Seek, today the Data Table. It is awesome for 2-variable problems, tomorrow you’ll see one with a 1-variable problem. The table array function cannot be manually entered, it will not work, you have to use Data, what-If Analysis, Data Table. I used a color scale, Home, Conditional Formatting, Color Scales, to color the answers. If you have 3 variables to change, you do scenarios? No, just make copies of the worksheet or copies of the table, they are slow to calculate, especially with a complex model. There is a calculation mode for Automatic for all except tables, and Owen W. Green suggested including this feature in the books.
So thanks to him, and thanks to you for stopping by, we’ll see you next time for another netcast from MrExcel!
Download File
Download the sample file here: Podcast2034.xlsx
Title Photo: Luisfpizarro / Pixabay