Data labels on the outside end of error bars without overlapping?

Crucis

New Member
Joined
Aug 31, 2017
Messages
5
g8abWk
Dear all,

I have a recurrent problem when making column/bar charts with error bars and data labels. Whenever I add data labels to the outside end, these labels will always overlap the error bars (please see image). Is there any automatic solution to position the data labels on the outside end of the error bars (instead of the column end)? Dragging each data label manually is annoying and time consuming when dealing with a lot of data.

Thanks in advance for your help! :)

4SlvCta.png
g8abWk
 

Excel Facts

Format cells as time
Select range and press Ctrl+Shift+2 to format cells as time. (Shift 2 is the @ sign).
This code will move all data labels for a specific series to specified position relative to each labels current position.

Code:
Option Explicit

Sub Test_MoveDataLabelsOnActiveChart()

    MoveDataLabelsOnActiveChart 1, 0, -10, True

End Sub

Sub MoveDataLabelsOnSpecifiedSeriesInActiveChart(lSeries As Long, sngX As Single, sngY As Single, Optional bReset As Boolean)
    'For the series lSeries on the active chart, if data labels are present, move them as specified
    'Positive sngX value moves label to right
    'Positive sngY value moves label down
    'If bReset is true the labels will be set to their original position before applying the specified correction.
    
    Dim lChartSeriesCount As Long
    Dim pt As Point
    
    If ActiveChart Is Nothing Then _
        MsgBox "Select a chart and try again.", , "Select Chart": GoTo End_Sub
    On Error Resume Next
    lChartSeriesCount = ActiveChart.SeriesCollection.Count
    If Err.Number <> 0 Then _
        MsgBox "No series in selected chart.", , "Add Series to Chart": GoTo End_Sub
    On Error GoTo 0
    If ActiveChart.SeriesCollection.Count < lSeries Then _
        MsgBox "Chart has " & lChartSeriesCount & " series.", , "Specified Series Does Not Exist": GoTo End_Sub
    If Not ActiveChart.SeriesCollection(lSeries).HasDataLabels Then
        MsgBox "The specified series does not have data labels.", , "Specified Series Does Not Have Labels": GoTo End_Sub
    End If
    
    If bReset Then
        'Reset the data labels to their original position before applying correction
        ActiveChart.SeriesCollection(lSeries).HasDataLabels = False
        ActiveChart.SeriesCollection(lSeries).HasDataLabels = True
    End If
        
    For Each pt In ActiveChart.SeriesCollection(lSeries).Points
        With pt.DataLabel
            .Left = pt.DataLabel.Left + sngX
            .Top = pt.DataLabel.Top + sngY
        End With
    Next
    
End_Sub:
    
End Sub
 
Last edited:
Upvote 0
Hey Phil,

Thanks for your help. Those are custom error bars, does it help with the code?

Best,

C
 
Upvote 0
Are the values for the custom error bars for each point stored in the workbook? What is the data layout (worksheet and ranges involved) for the data names, data values, upper error bars and lower error bars?
Bar charts (horizontal) Column charts (vertical) or both?
 
Upvote 0
Are the values for the custom error bars for each point stored in the workbook? What is the data layout (worksheet and ranges involved) for the data names, data values, upper error bars and lower error bars?
Bar charts (horizontal) Column charts (vertical) or both?


Hi Phil,

Once again, thanks for your willingness to help. Yes, it's a very straightforward layout. Please check the picture below for all details (btw, values for upper/lower error bars are the same, although I just plot the plus error bar for aesthetic reasons).

nBjbw0Z.png

yTPIr.png
 
Upvote 0
You're welcome.

Code:
Option Explicit

Sub Test_MoveDataLabelsOnActiveChart()

    MoveDataLabelsOnSpecifiedSeriesInActiveChart 1, 0, -10, "CustomColumn", True

End Sub

Sub MoveDataLabelsOnSpecifiedSeriesInActiveChart(lSeries As Long, sngX As Single, sngY As Single, Optional sTypeErrorBar As String, Optional bReset As Boolean)
    'For the series lSeries on the active chart, if data labels are present, move them as specified
    'Positive sngX value moves label to right
    'Positive sngY value moves label down
    'sTypeErrorBar (only the following are implemented)
    '               "FixedValueColumn"  uses sngX & sngY for offset 'Can be used for column or bar charts.
    '               "CustomColumn"      uses column to right of values for vertical offset.  Designed for Column Charts Only
    'If bReset is true the labels will be set to their original position before applying the specified correction.
    
    Dim lChartSeriesCount As Long
    Dim pt As Point
    Dim sngOffset As Single
    Dim sngMultiplier As Single
    Dim sValuesRange As String
    Dim aryErrors As Variant
    Dim aryValues As Variant
    Dim lPointIndex As Long
    Dim lPointCount As Long
    Dim sngScalingFactor As Single
    Dim sngMaxValue As Single
    Dim sngValue As Single
    Dim lMaxPoint As Long
    Dim sngColumnHeight As Single
    
    If ActiveChart Is Nothing Then _
        MsgBox "Select a chart and try again.", , "Select Chart": GoTo End_Sub
    On Error Resume Next
    lChartSeriesCount = ActiveChart.SeriesCollection.Count
    If Err.Number <> 0 Then _
        MsgBox "No series in selected chart.", , "Add Series to Chart": GoTo End_Sub
    On Error GoTo 0
    If ActiveChart.SeriesCollection.Count < lSeries Then _
        MsgBox "Chart has " & lChartSeriesCount & " series.", , "Specified Series Does Not Exist": GoTo End_Sub
    If Not ActiveChart.SeriesCollection(lSeries).HasDataLabels Then
        MsgBox "The specified series does not have data labels.", , "Specified Series Does Not Have Labels": GoTo End_Sub
    End If
    
    If bReset Then
        'Reset the data labels to their original position before applying correction
        ActiveChart.SeriesCollection(lSeries).HasDataLabels = False
        ActiveChart.SeriesCollection(lSeries).HasDataLabels = True
    End If
    
    lPointCount = ActiveChart.SeriesCollection(lSeries).Points.Count
    
    Select Case sTypeErrorBar
    Case "CustomColumn"
        sValuesRange = Split(ActiveChart.SeriesCollection(lSeries).Formula, ",")(2)
        aryErrors = Range(Split(sValuesRange, "!")(1)).Offset(0, 1)
        aryValues = Range(Split(sValuesRange, "!")(1))
       
        'Calculate Offset Scaling Factor based on tallest column
        sngMaxValue = 0
        For lPointIndex = 1 To lPointCount
            sngValue = aryValues(lPointIndex, 1)
            If sngValue > sngMaxValue Then
                sngMaxValue = sngValue
                lMaxPoint = lPointIndex
            End If
        Next
        sngColumnHeight = ActiveChart.SeriesCollection(lSeries).Points(lMaxPoint).Height
        sngScalingFactor = sngColumnHeight / sngMaxValue
        
        'Move Labels
        For lPointIndex = 1 To lPointCount
            With ActiveChart.SeriesCollection(lSeries).Points(lPointIndex).DataLabel
                .Top = .Top - (aryErrors(lPointIndex, 1) * sngScalingFactor)
            End With
        Next
    Case "FixedValueColumn"
        For Each pt In ActiveChart.SeriesCollection(lSeries).Points
            With pt.DataLabel
                .Left = pt.DataLabel.Left + sngX
                .Top = pt.DataLabel.Top + sngY
            End With
        Next
    Case Else
        MsgBox "Not yet implemented"
    End Select
    
End_Sub:
    
End Sub

Have you considered moving the label a bit to the side so it was still just above the top of the bar, but not on top of the error bar line?
 
Last edited:
Upvote 0
Responding to PM that I cannot reply to (mailbox full message)

... The easiest way to do this is to simply add 'data labels' and then replace the numeric value for the desired letter (instead of individually adding text boxes). Yet, one still has to manually move each data label/letter above the error bar because excel does not have this function. Your code fixes this problem and will save me a lot of hassle, so thank you very much.


You are welcome. So would it be useful if you could put the labels you actually want in E4:E10 (as per Post #6 ) and replace (or append) the label to the error value?
 
Upvote 0
I added a bit of code to allow editing of the numeric data label value. If it would be useful for your application it would also be possible to add code to change the fill color and/or border color of individual data labels or data bars. Change "False" to "True" in the first line of the last "paragraph" in the code to see a sample of coloring the data label.

Code:
Option Explicit

Sub Test_MoveDataLabelsOnActiveChart()

    MoveDataLabelsOnSpecifiedSeriesInActiveChart 1, 0, -10, "CustomColumn", True, "OVERwRITe"

End Sub

Sub MoveDataLabelsOnSpecifiedSeriesInActiveChart(lSeries As Long, sngX As Single, sngY As Single, _
    Optional sTypeErrorBar As String, Optional bReset As Boolean, Optional sEditDataLabel As String)
    'For the series lSeries on the active chart, if data labels are present, move them as specified
    
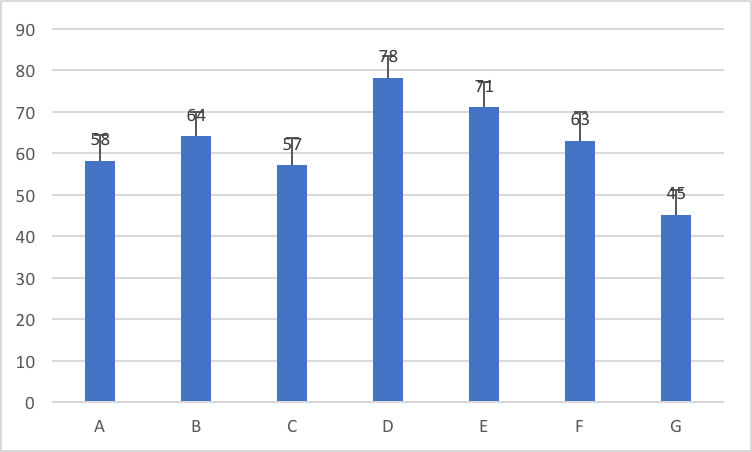
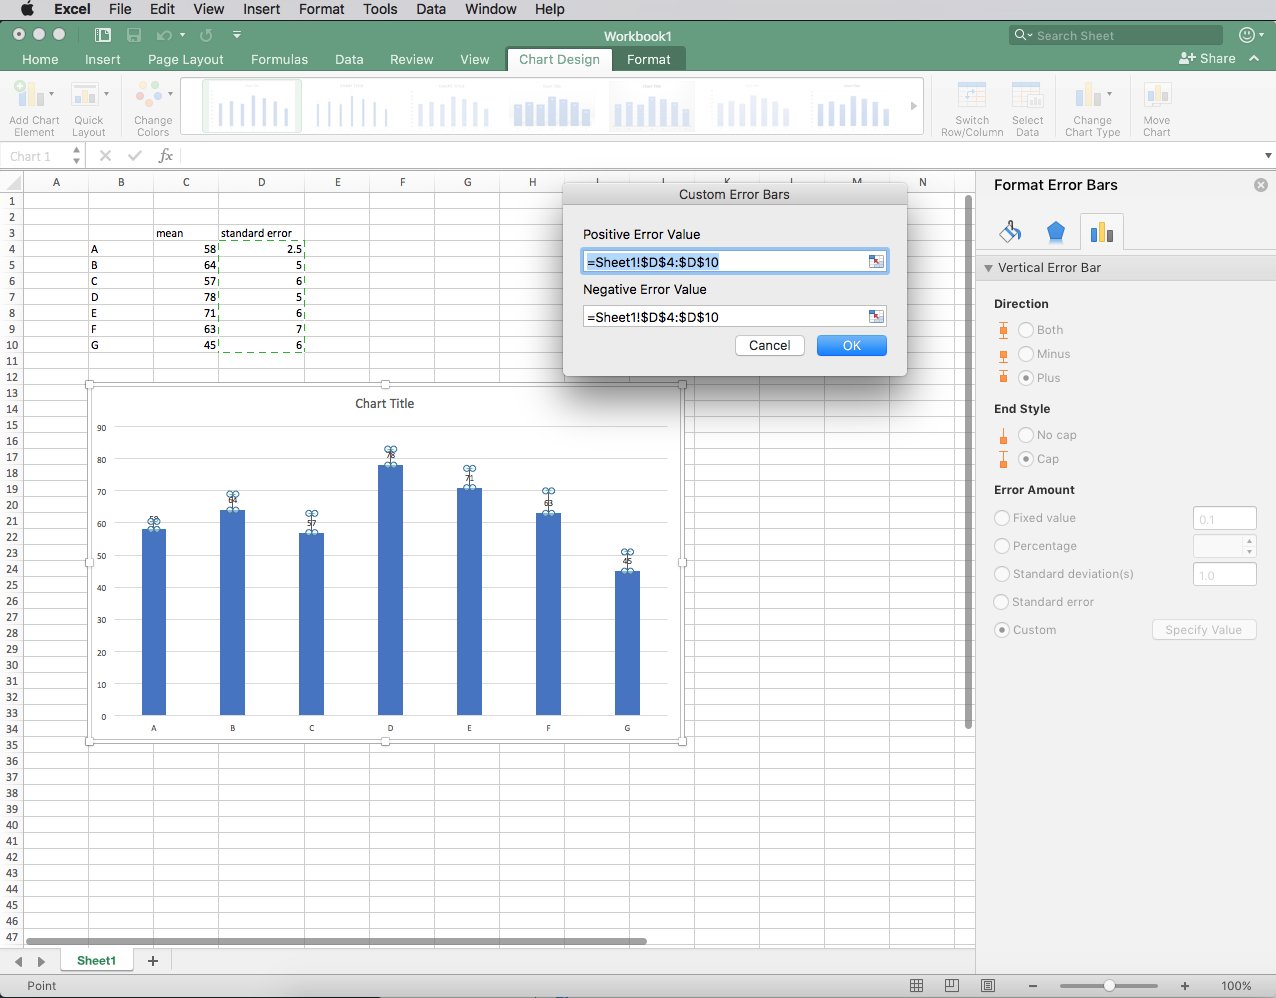
    'The data for the column chart must be arranged as follows:
    '1st Column:    Data Point Name
    '2nd Column:    Data Point Value
    '3rd Column:    Data Point Error Bar Value (will provide odd results if negative)
    '4th Column:    Data Label Modifier Value
    
    'Positive sngX value moves label to right
    'Positive sngY value moves label down
    'sTypeErrorBar (only the following are implemented)
    '               "FixedValueColumn"  uses sngX & sngY for offset 'Can be used for column or bar charts.
    '               "CustomColumn"      uses column to right of values for vertical offset.  Designed for Column Charts Only
    'If bReset is true the labels will be set to their original position before applying the specified correction.
    'sEditDataLabel if one of the following options is specified the data label will be modified as follows:
    '               "AppendWithSpace"   - Space & Data Label Modifier Value will be added after the current Data Label Value
    '               "AppendWithCR"      - Data Label Modifier Value will be added under the current Data Label Value
    '               "Overwrite"         - Data Label Value will be replaced with the Data Label Modifier Value
    
    Dim lChartSeriesCount As Long
    Dim pt As Point
    Dim sngOffset As Single
    Dim sngMultiplier As Single
    Dim sValuesRange As String
    Dim aryErrors As Variant
    Dim aryValues As Variant
    Dim aryDataLabels As Variant
    Dim lPointIndex As Long
    Dim lPointCount As Long
    Dim sngScalingFactor As Single
    Dim sngMaxValue As Single
    Dim sngValue As Single
    Dim lMaxPoint As Long
    Dim sngColumnHeight As Single
    
    If ActiveChart Is Nothing Then _
        MsgBox "Select a chart and try again.", , "Select Chart": GoTo End_Sub
    On Error Resume Next
    lChartSeriesCount = ActiveChart.SeriesCollection.Count
    If Err.Number <> 0 Then _
        MsgBox "No series in selected chart.", , "Add Series to Chart": GoTo End_Sub
    On Error GoTo 0
    If ActiveChart.SeriesCollection.Count < lSeries Then _
        MsgBox "Chart has " & lChartSeriesCount & " series.", , "Specified Series Does Not Exist": GoTo End_Sub
    If Not ActiveChart.SeriesCollection(lSeries).HasDataLabels Then
        MsgBox "The specified series does not have data labels.", , "Specified Series Does Not Have Labels": GoTo End_Sub
    End If
    
    If bReset Then
        'Reset the data labels to their original position before applying correction
        ActiveChart.SeriesCollection(lSeries).HasDataLabels = False
        ActiveChart.SeriesCollection(lSeries).HasDataLabels = True
    End If
    
    lPointCount = ActiveChart.SeriesCollection(lSeries).Points.Count
    
    Select Case sTypeErrorBar
    Case "CustomColumn"
        sValuesRange = Split(ActiveChart.SeriesCollection(lSeries).Formula, ",")(2)
        aryErrors = Range(Split(sValuesRange, "!")(1)).Offset(0, 1)
        aryValues = Range(Split(sValuesRange, "!")(1))
        aryDataLabels = Range(Split(sValuesRange, "!")(1)).Offset(0, 2)
        
        'Calculate Offset Scaling Factor based on tallest column
        sngMaxValue = 0
        For lPointIndex = 1 To lPointCount
            sngValue = aryValues(lPointIndex, 1)
            If sngValue > sngMaxValue Then
                sngMaxValue = sngValue
                lMaxPoint = lPointIndex
            End If
        Next
        sngColumnHeight = ActiveChart.SeriesCollection(lSeries).Points(lMaxPoint).Height
        sngScalingFactor = sngColumnHeight / sngMaxValue
        
        'Move Labels
        For lPointIndex = 1 To lPointCount
            With ActiveChart.SeriesCollection(lSeries).Points(lPointIndex).DataLabel
                .Top = .Top - (aryErrors(lPointIndex, 1) * sngScalingFactor)
            End With
        Next
    Case "FixedValueColumn"
        For Each pt In ActiveChart.SeriesCollection(lSeries).Points
            With pt.DataLabel
                .Left = pt.DataLabel.Left + sngX
                .Top = pt.DataLabel.Top + sngY
            End With
        Next
    Case Else
        MsgBox "Not yet implemented"
    End Select
    
    'Edit Data Labels
    Select Case UCase(sEditDataLabel)
    Case ""
        'Do nothing
    Case "APPENDWITHSPACE"
        For lPointIndex = 1 To lPointCount
            With ActiveChart.SeriesCollection(lSeries).Points(lPointIndex).DataLabel
                .Text = .Text & " " & aryDataLabels(lPointIndex, 1)
            End With
        Next
    Case "APPENDWITHCR"
        For lPointIndex = 1 To lPointCount
            With ActiveChart.SeriesCollection(lSeries).Points(lPointIndex).DataLabel
                .Text = .Text & vbLf & aryDataLabels(lPointIndex, 1)
            End With
        Next
    Case "OVERWRITE"
        For lPointIndex = 1 To lPointCount
            With ActiveChart.SeriesCollection(lSeries).Points(lPointIndex).DataLabel
                .Text = aryDataLabels(lPointIndex, 1)
            End With
        Next
    Case Else
        MsgBox sEditDataLabel & " is not a valid option for sEditDataLabel.  Use one of the following:" & vbLf & _
            "    AppendWithSpace" & vbLf & _
            "    AppendWithCR" & vbLf & _
            "    Overwrite" & vbLf, , "Invalid Edit Data Label Option"
    End Select
    
    
    'Color Data Labels
    If False Then  'Change 2nd word in this line to True to color data labels to specified colors.
        For lPointIndex = 1 To lPointCount
            ActiveChart.SeriesCollection(lSeries).Points(lPointIndex).DataLabel.Select
            With Selection.Format.Fill
                .Visible = msoTrue
                .ForeColor.RGB = RGB(255, 255, 0)
                .Transparency = 0
                .Solid
            End With
            With Selection.Format.Line
                .Visible = msoTrue
                .ForeColor.RGB = rgbRed
                .Transparency = 0
            End With
        Next
    End If
    
End_Sub:
    
End Sub
 
Upvote 1

Forum statistics

Threads
1,214,386
Messages
6,119,220
Members
448,876
Latest member
Solitario

We've detected that you are using an adblocker.

We have a great community of people providing Excel help here, but the hosting costs are enormous. You can help keep this site running by allowing ads on MrExcel.com.
Allow Ads at MrExcel

Which adblocker are you using?

Disable AdBlock

Follow these easy steps to disable AdBlock

1)Click on the icon in the browser’s toolbar.
2)Click on the icon in the browser’s toolbar.
2)Click on the "Pause on this site" option.
Go back

Disable AdBlock Plus

Follow these easy steps to disable AdBlock Plus

1)Click on the icon in the browser’s toolbar.
2)Click on the toggle to disable it for "mrexcel.com".
Go back

Disable uBlock Origin

Follow these easy steps to disable uBlock Origin

1)Click on the icon in the browser’s toolbar.
2)Click on the "Power" button.
3)Click on the "Refresh" button.
Go back

Disable uBlock

Follow these easy steps to disable uBlock

1)Click on the icon in the browser’s toolbar.
2)Click on the "Power" button.
3)Click on the "Refresh" button.
Go back
Back
Top