Probabilities for Occurance of Independent Events

rupophobe

New Member
Joined
Nov 17, 2017
Messages
5
Greetings; I spent some time searching but did not seem to find the answer I'm looking for, so hopefully this is not a repeat question. Nevertheless, I feel like this should have a simple answer; I just don't know what it is.

Say I have a finite list of multiple independent events (no real limit on the number of such, but for the example I'll use 20), and each event has a known probability of occurrence. While I don't need the odds of every possible permutation of events, I am interested in calculating the odds for the number of events which occur.

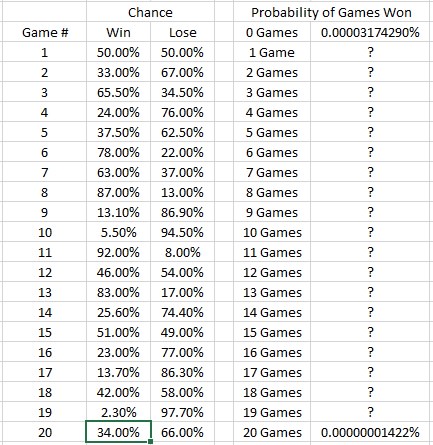
Perhaps a clarifying example: if the each event represents a game played, and each game has a known win probability, what are the odds of winning 0 games, 1 game, 2 games, ... 20 games? Obviously the calculation is easy for 0 or 20 games, but there are too many permutations for a brute force approach to the other 19 possibilities.

Any assistance would be greatly appreciated. Thanks!
 

Excel Facts

Excel motto
Not everything I do at work revolves around Excel. Only the fun parts.
Welcome to the forum.

This is really more of a probability question than an Excel question, but there is a formula to answer that. If the probability of winning a game is p, and you want to know the probability of winning exactly k games out of n games, the formula is:

C(n,k) * p^k * (1-p)^(n-k)

If A1 = p, A2 = n, and A3 = k, the Excel formula is:

=COMBIN(A2,A3)*A1^A3*(1-A1)^(A2-A3)
 
Upvote 0
Thank you for the reply, but I'm afraid it doesn't solve my problem. It would seem that I was insufficiently clear that the probability of each 'game' is different; please see the example below:
nW1kOt8.jpg
 
Upvote 0
Just to follow up with additional clarification. I certainly know I could set up matrices and calculate the probability of each permutation and then sum them up, but there are for the above example, 184,756 different ways to win exactly 10 games (and 167,960 ways to win exactly 9 or 11 games, etc.). Is there a way to automate this in Excel?
 
Upvote 0
Upvote 0
AhoyNC - thanks for the suggestion; I was able to get satisfactory solution on a stats forum. Appreciate the help.
 
Upvote 0
Glad you found a solution. Was it an Excel solution? If so how about posting a link to the answer.
 
Upvote 0
There's a nagging suspicion in my head that there might be a mathematical solution to this, but it would take me a lot of research to get there. So I reverted to a brute force approach, where I compute each permutation, calculate the odds of it occurring, then add that to the appropriate bucket. Given a sheet layout like you showed:

Book1 (version 1).xlsb
ABCDEF
1Probability
2GameWinLose0.00003174290%
3150.00%50.00%0.00116800144%
4233.00%67.00%0.01792542343%
5365.50%34.50%0.15358108858%
6424.00%76.00%0.82913849909%
7537.50%62.50%3.01914675766%
8678.00%22.00%7.74935403275%
9763.00%37.00%14.45259862629%
10887.00%13.00%20.00154452920%
11913.10%86.90%20.83138266459%
12105.50%94.50%16.46326030695%
131192.00%8.00%9.90463737991%
141246.00%54.00%4.52792721322%
151383.00%17.00%1.56165822225%
161425.60%74.40%0.40090037550%
171551.00%49.00%0.07495688568%
181623.00%77.00%0.00987088570%
191713.70%86.30%0.00086903688%
201842.00%58.00%0.00004697705%
21192.30%97.70%0.00000133673%
222034.00%66.00%0.00000001422%
23
24100.00000000000%
Sheet20
Cell Formulas
RangeFormula
F24F24=SUM(F2:F22)


I used this macro to do the computation:

Code:
Sub CountEm()
Dim i As Long, j As Long, str1 As String, wk As Double
Dim probs As Variant, outprobs(0 To 20, 1 To 1) As Double, ctr As Long
   
    probs = Range("B3:C22").Value
   
    For i = 0 To 2 ^ 20 - 1
        ctr = 0
        str1 = WorksheetFunction.Base(i, 2, 20)
        wk = 1
        ctr = 0
        For j = 1 To 20
            If Mid(str1, j, 1) = "1" Then
                wk = wk * probs(j, 1)
                ctr = ctr + 1
            Else
                wk = wk * probs(j, 2)
            End If
        Next j
        outprobs(ctr, 1) = outprobs(ctr, 1) + wk
    Next i
   
    Range("F2:F22").Value = outprobs

End Sub
It took just over 10 seconds on my PC. As a sanity check, the first and last values match your calculated totals, and the sum of all the percentages is 1, as you'd expect. Also, if you plot the percentages, the curve looks roughly normal.

Hope this works for you.
 
Last edited:
Upvote 0
What version of Excel do you have? I just realized that the Base function I used was introduced in Excel 2013. If you have an earlier version, that could explain why the macro didn't work for you. If you're still interested in this, I'll write up a version that doesn't use Base.
 
Upvote 0

Forum statistics

Threads
1,214,551
Messages
6,120,159
Members
448,948
Latest member
spamiki

We've detected that you are using an adblocker.

We have a great community of people providing Excel help here, but the hosting costs are enormous. You can help keep this site running by allowing ads on MrExcel.com.
Allow Ads at MrExcel

Which adblocker are you using?

Disable AdBlock

Follow these easy steps to disable AdBlock

1)Click on the icon in the browser’s toolbar.
2)Click on the icon in the browser’s toolbar.
2)Click on the "Pause on this site" option.
Go back

Disable AdBlock Plus

Follow these easy steps to disable AdBlock Plus

1)Click on the icon in the browser’s toolbar.
2)Click on the toggle to disable it for "mrexcel.com".
Go back

Disable uBlock Origin

Follow these easy steps to disable uBlock Origin

1)Click on the icon in the browser’s toolbar.
2)Click on the "Power" button.
3)Click on the "Refresh" button.
Go back

Disable uBlock

Follow these easy steps to disable uBlock

1)Click on the icon in the browser’s toolbar.
2)Click on the "Power" button.
3)Click on the "Refresh" button.
Go back
Back
Top