how to create chart sheet

bhandari

Active Member
Joined
Oct 17, 2017
Messages
359
How to create multiple charts at one time by clicking the command button

i need 1 to 10 sheets
Chart1 to chart10
 
Last edited:

Excel Facts

Copy formula down without changing references
If you have =SUM(F2:F49) in F50; type Alt+' in F51 to copy =SUM(F2:F49) to F51, leaving the formula in edit mode. Change SUM to COUNT.
Can you please find the link below.

You can find sheet 2 in that you can find C2:BJ2 this are the Intervals-->X-Direction
B3:B30 have Y-Direction
C3:BJ3 need to plot in 7.800 chart(Chart3)
i have tried in Chart 3 take a look in it. but it looks like chart is not expanding and its not clear to shows intervals.
Sir can you please fix this iam looking for this from long time

A3:A83 are chart names(i need 80 charts)

can i do it with macro?

https://drive.google.com/open?id=1gkgw_pP3BqJJlnExk6QPgz7nqHn3UjaK
 
Last edited:
Upvote 0
Which version of Excel are you using? I am using Excel 2016.

I do hope you can translate this into clear terms.

This will be easier if we transpose the data.

  • Insert a new worksheet (a new tab).
  • In the worksheet with the original data, Sheet2, select cell A2. Press Ctrl+*. This selects the Current Region. Press Ctrl+c to copy the current region.

In the new worksheet

  1. Select cell A1. then Paste Special-Transpose.
  2. Select rows 3:4. Insert two new rows.
  3. Place a text header in each cell from B4 to CD4. The text allows Excel to recognize these cells as header cells.
  4. Select cells B4:C66. Insert a Scatter(XY) chart, scatter with straight lines chart.
  5. Move the chart to a new sheet.

I will leave the actual chart formatting to you. I have an example file you can download from dropbox: https://www.dropbox.com/s/4u4yenrm9...NAL CH 7800 TO 9800 BHS 14.11.2017.xlsx?dl=0

The next chart will use the data from B4:B66 and D4:D66. Chart production could be automated using VBA.

Once you have one chart correctly formatted you can copy that formatting and paste it onto the other charts. Copy the formatted chart. Select the unformatted chart. From the ribbon, select the down arrow below the big clipboard paste icon. Select Paste Special, then select Formats and click OK.
 
Upvote 0
Hey Thank for Your help man..i have got a hope we can do anything in Excel..You proved it

i need you to little more time time to spend on my work to bring it to shape..i have attached Link below. i Explain my Requiremnts in Transposed,NewFormattedChart (Check Two sheets)

Chart is looking like small if i reduce Intervals can't we expand the Size of Chart?
i would like to suggest you to Draw Cross section @Km.9.025(Levels are sufficent to draw Upper Head)
https://www.dropbox.com/s/x7bylkim5...NAL CH 7800 TO 9800 BHS 14.11.2017.xlsx?dl=0
 
Last edited:
Upvote 0
One item at a time.

The size of a chart on a chart sheet depends on the size of the printed page. My Excel is set for U.S. paper sizes: Letter is 8.5 x 11.0 inches or 216 × 279 mm, Legal is 8.5 x 11 inches or 216 × 356 mm. What size paper are you using?

We can set the size of an embedded chart to anything we want. Just tell me the dimensions you want. I'll try the KM 9.025 chart tomorrow. It is too late in the day, or too early in the morning for me to think clearly.

In the meantime, here is a test spreadsheet where the gridlines can be made square with the click of a button. The VBA is from Jon Peltier and I just slightly modified the code. Experiment with different paper sizes and you will see how the scale of the graph can change. The gridlines go out of square with the changes in paper sizes. I think you will have to use charts embedded in a worksheet. That will allow you to create a custom size and to get printed charts that can be amended by hand.

Embedded charts do not have to be on the same worksheet with the data. A new worksheet could be created for each chart if you wanted to do so.

https://www.dropbox.com/s/537hjrzmu9jq1qz/bhandari_chart_test-01.xlsm?dl=0
 
Last edited:
Upvote 0
iam also using 2016 version
i need to merge
Size:A0841 x 1189 mm33.1 x 46.8 in

<tbody>
</tbody>
is it possible to use Grid lines because it is easy to find the exact location between interval.
Please find the graph Link below
There are lot of plotting lines are there i cant show them separate sheets
all need to plot in single chart otherwise its not worth for my project.

https://drive.google.com/open?id=1ZI-fj_KHzVtFlimNJ0649_ms1nJrQmkK?
its a mm(millimeter Graph) i need this kind of Back ground or else it must be visible in A0 size
 
Upvote 0
Link Update old one is missing.if i click on command button it s changing to square but there is a issue with this Elevation(Y-Axis) is changing automatically. i want to fix this between 406 to 456 (2 meter interval for Y-axis)(X-axis =3m interval gap Required)i need to fix this it looks like 6 Verticle,2 Horizontal Grid lines are showing.(i need 10 Grid line Horizontal,Vertical) i can get Square shape with fixed Elevation

My intention to plot all the Lines in chart for one Chainage

https://drive.google.com/file/d/1ZI-fj_KHzVtFlimNJ0649_ms1nJrQmkK/view
 
Upvote 0
Gosh! That's expensive paper. Good news for me that you use the 2016 version—I don't have to consider backward compatibility.

I was unable to connect to the link in post #6; the link in post #7 was OK.

I haven't worked on the requirements you gave in your last two posts. I will probably start this evening. Would you please post the exact requirements for the gridlines: the major and minor units?

ij0gXVD.png


I did resize the graphs for two per A4 sheet, using the same horizontal and vertical scales, multiples of 3 for the gridlines. I know now that I have to change this.

This is the link for my latest test file:
https://www.dropbox.com/s/4xo76fnd5h9h5ix/bhandari_print_test-01.xlsm?dl=0

The updated links for the previous two files:
https://www.dropbox.com/s/537hjrzmu9jq1qz/bhandari_chart_test-01.xlsm?dl=0

https://www.dropbox.com/s/4u4yenrm9...NAL CH 7800 TO 9800 BHS 14.11.2017.xlsx?dl=0
 
Upvote 0
In your latest post i have seen 8 vertical lines only. as per the Size Requirements it must be A0
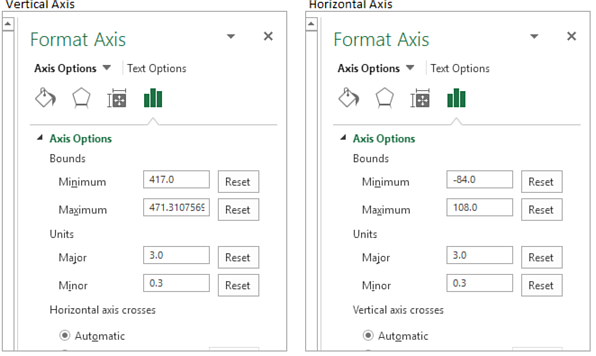
Vertical Axis
Format Axis 406 to 460
major 3
minor 0.2

Horizontal Axis -84 to 108

I dont know how Grid lines will show in chart, iam looking for 10 Grid line between cell starting interval 0,3,6...etc as per table
in between 0 to 3 [0.2,0.4,0.6,0.8,1.0,1.2,1.4,1.6,1.8,2.0]=10 Gridlines
[2.2,2.4,2.6,2.8,3.0]=5 Grid lines..[1:2 ratio] so 3 interval is coming center between 2 major axis(I hope You understood)..Let me know i can show you Pic if u not understood

Here scroll down in sheet "transposed" You can find Picture i have mentioned requirements,i have given data for plotting let me know if u need anything..is it possible to chat with mail..this is my personal project i dont want to publish without complete it.gmail id:bhandarilakhpat123@gmail.com

Please find the Link below

https://drive.google.com/open?id=1Eh1sjUvlVu9bNUos3IwwVCNy0lkvDMxC
 
Last edited:
Upvote 0

Forum statistics

Threads
1,214,651
Messages
6,120,738
Members
448,988
Latest member
BB_Unlv

We've detected that you are using an adblocker.

We have a great community of people providing Excel help here, but the hosting costs are enormous. You can help keep this site running by allowing ads on MrExcel.com.
Allow Ads at MrExcel

Which adblocker are you using?

Disable AdBlock

Follow these easy steps to disable AdBlock

1)Click on the icon in the browser’s toolbar.
2)Click on the icon in the browser’s toolbar.
2)Click on the "Pause on this site" option.
Go back

Disable AdBlock Plus

Follow these easy steps to disable AdBlock Plus

1)Click on the icon in the browser’s toolbar.
2)Click on the toggle to disable it for "mrexcel.com".
Go back

Disable uBlock Origin

Follow these easy steps to disable uBlock Origin

1)Click on the icon in the browser’s toolbar.
2)Click on the "Power" button.
3)Click on the "Refresh" button.
Go back

Disable uBlock

Follow these easy steps to disable uBlock

1)Click on the icon in the browser’s toolbar.
2)Click on the "Power" button.
3)Click on the "Refresh" button.
Go back
Back
Top