Hello,
I need to make a graph for a set of data shown below
<tbody>
</tbody>
I have tried countless different methods and cant find a way. The right hand column needs to be on the y-axis.
Cheers for any help
OldBirch
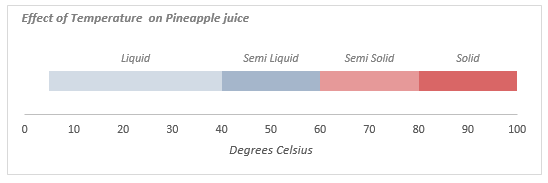
I need to make a graph for a set of data shown below
| 20 degrees | Liquid |
| 40 | semi liquid |
| 60 | semi solid |
| 80 | solid |
| 100 | solid |
<tbody>
</tbody>
I have tried countless different methods and cant find a way. The right hand column needs to be on the y-axis.
Cheers for any help
OldBirch