[FONT="]Hello,[/FONT]
[FONT="]I'm Looking for an excel Formula or VBA code to color (highlight or background fill) columns based on the count series of max frequency consecutive positive numbers. It should be left open ended for more data to be added after column P and Lower than row 5.[/FONT]
[FONT="]

 [/FONT]
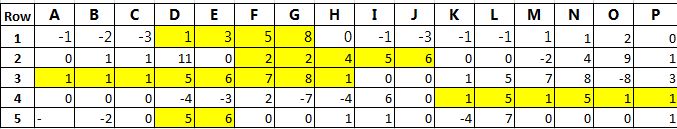
[FONT="]Rows described:[/FONT]
[FONT="]1. max positive count is 4 highlighted, sum is 17 [/FONT]
[FONT="]2 max positive count is 5 highlighted, sum is 19[/FONT]
[FONT="]3. max positive count is 8 highlighted, sum is 30
4. max positive count is 6 highlighted, sum is 14
5. max positive count is 2 highlighted, sum is 11
[/FONT]
[FONT="]I'm Looking for an excel Formula or VBA code to color (highlight or background fill) columns based on the count series of max frequency consecutive positive numbers. It should be left open ended for more data to be added after column P and Lower than row 5.[/FONT]
[FONT="]
[FONT="]Rows described:[/FONT]
[FONT="]1. max positive count is 4 highlighted, sum is 17 [/FONT]
[FONT="]2 max positive count is 5 highlighted, sum is 19[/FONT]
[FONT="]3. max positive count is 8 highlighted, sum is 30
4. max positive count is 6 highlighted, sum is 14
5. max positive count is 2 highlighted, sum is 11
[/FONT]
") The code works great.
The code works great.


