Pivot Chart Frustration

abmorgan

New Member
Joined
Apr 2, 2019
Messages
2
Can anyone help?
I am attempting to capture a percentage of a count in a column in a pivot chart.

Example:
In January 3000 customer service calls were made. Of which 300 were unresolvable.

I am attempting to capture what percentage of January's calls could not be resolved and display it on a excel dashboard I created. I have been at this for days with no solutions.

Can anyone help!?
 

Excel Facts

Why are there 1,048,576 rows in Excel?
The Excel team increased the size of the grid in 2007. There are 2^20 rows and 2^14 columns for a total of 17 billion cells.
Something like this:

fea9b623bec7a29c5c4f8ede2221de7c.jpg
 
Upvote 0
Try

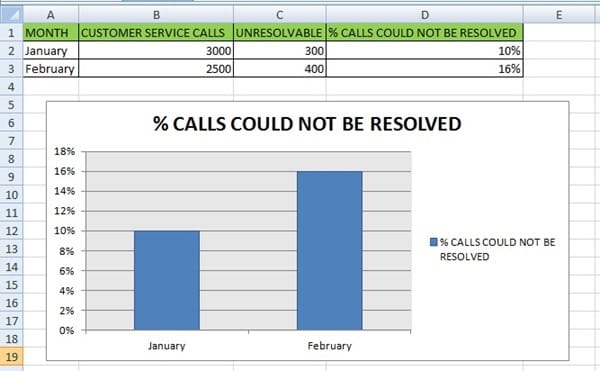
<b>Sheet</b><br /><br /><table border="1" cellspacing="0" style="font-family:Calibri,Arial; font-size:11pt; background-color:#ffffff; "> <colgroup><col style="font-weight:bold; width:30px; " /><col style="width:62px;" /><col style="width:172px;" /><col style="width:103px;" /><col style="width:219px;" /></colgroup><tr style="background-color:#cacaca; text-align:center; font-weight:bold; font-size:8pt; "><td > </td><td >A</td><td >B</td><td >C</td><td >D</td></tr><tr style="height:18px ;" ><td style="font-size:8pt; background-color:#cacaca; text-align:center; " >1</td><td style="background-color:#92d050; ">MONTH</td><td style="background-color:#92d050; ">CUSTOMER SERVICE CALLS </td><td style="background-color:#92d050; ">UNRESOLVABLE</td><td style="background-color:#92d050; ">% CALLS COULD NOT BE RESOLVED</td></tr><tr style="height:18px ;" ><td style="font-size:8pt; background-color:#cacaca; text-align:center; " >2</td><td >January</td><td style="text-align:right; ">3000</td><td style="text-align:right; ">300</td><td style="text-align:right; ">10%</td></tr><tr style="height:18px ;" ><td style="font-size:8pt; background-color:#cacaca; text-align:center; " >3</td><td >February</td><td style="text-align:right; ">2500</td><td style="text-align:right; ">400</td><td style="text-align:right; ">16%</td></tr></table><br /><table style="font-family:Arial; font-size:10pt; border-style: groove ;border-color:#00ff00;background-color:#fffcf9; color:#000000; "><tr><td ><b></b></td></tr><tr><td ><table border = "1" cellspacing="0" cellpadding="2" style="font-family:Arial; font-size:9pt;"><tr style="background-color:#cacaca; font-size:10pt;"><td >Cell</td><td >Formula</td></tr><tr><td >D2</td><td >=C2/B2</td></tr><tr><td >D3</td><td >=C3/B3</td></tr></table></td></tr></table> <br /><br />
 
Upvote 0

Forum statistics

Threads
1,214,782
Messages
6,121,532
Members
449,037
Latest member
tmmotairi

We've detected that you are using an adblocker.

We have a great community of people providing Excel help here, but the hosting costs are enormous. You can help keep this site running by allowing ads on MrExcel.com.
Allow Ads at MrExcel

Which adblocker are you using?

Disable AdBlock

Follow these easy steps to disable AdBlock

1)Click on the icon in the browser’s toolbar.
2)Click on the icon in the browser’s toolbar.
2)Click on the "Pause on this site" option.
Go back

Disable AdBlock Plus

Follow these easy steps to disable AdBlock Plus

1)Click on the icon in the browser’s toolbar.
2)Click on the toggle to disable it for "mrexcel.com".
Go back

Disable uBlock Origin

Follow these easy steps to disable uBlock Origin

1)Click on the icon in the browser’s toolbar.
2)Click on the "Power" button.
3)Click on the "Refresh" button.
Go back

Disable uBlock

Follow these easy steps to disable uBlock

1)Click on the icon in the browser’s toolbar.
2)Click on the "Power" button.
3)Click on the "Refresh" button.
Go back
Back
Top