$ difference column in year over year pivot table

girlgirlgirl

New Member
Joined
Jul 2, 2019
Messages
1
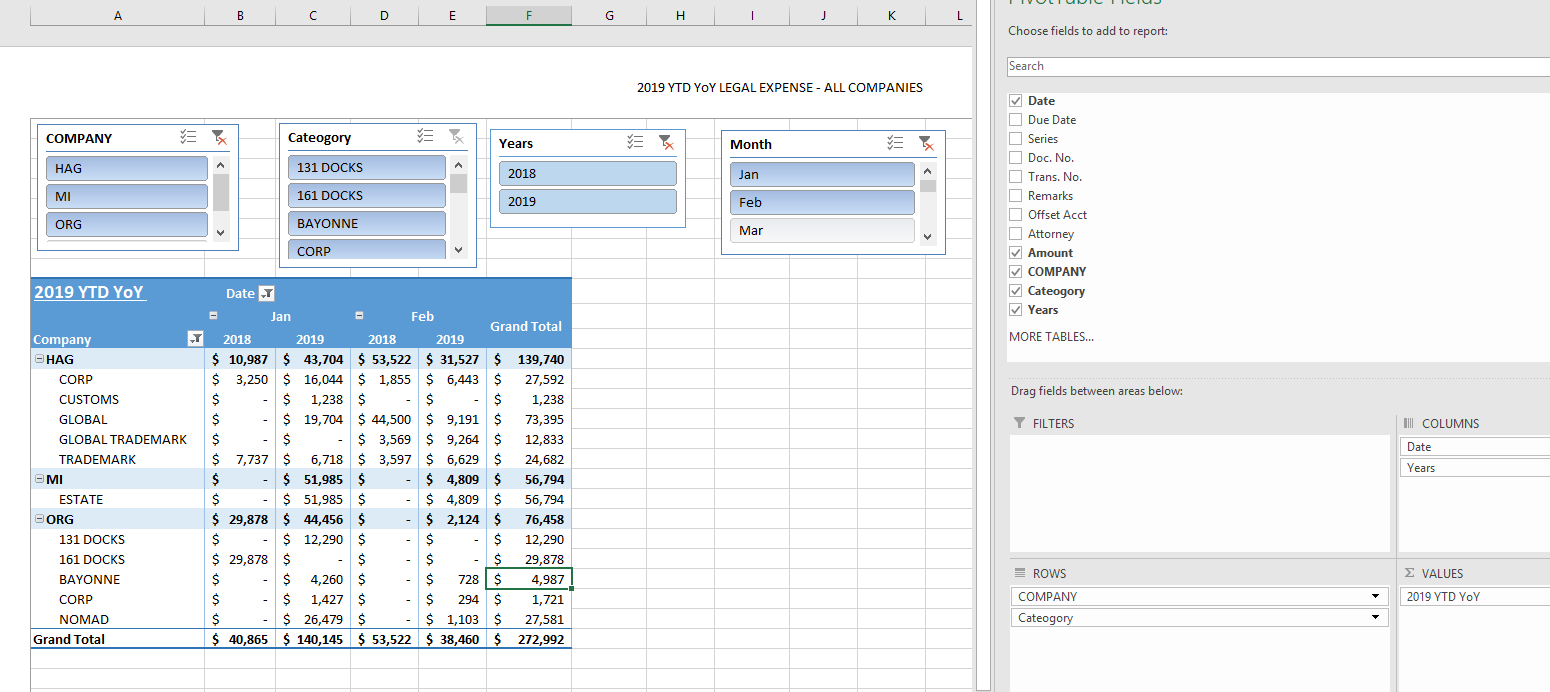
Hi all - I am trying to include a year over year $ difference in my pivot table but all the examples I see have the dates in a row field vs column. I want to just have one column after 2019 #s that calculates the difference from prior year. If I drag the amount field again in the values field it gives me too many columns. See below my table.


Capture.png

0cZXmwj
0cZXmwj
 

Excel Facts

Can you sort left to right?
To sort left-to-right, use the Sort dialog box. Click Options. Choose "Sort left to right"
Hi there girlgirlgirl - Welcome to the forum! :) I am not seeing any table below. It may help things get started if you typed in a few rows as an example. Hope this helps to get an answer started.
 
Upvote 0

Forum statistics

Threads
1,214,650
Messages
6,120,736
Members
448,988
Latest member
BB_Unlv

We've detected that you are using an adblocker.

We have a great community of people providing Excel help here, but the hosting costs are enormous. You can help keep this site running by allowing ads on MrExcel.com.
Allow Ads at MrExcel

Which adblocker are you using?

Disable AdBlock

Follow these easy steps to disable AdBlock

1)Click on the icon in the browser’s toolbar.
2)Click on the icon in the browser’s toolbar.
2)Click on the "Pause on this site" option.
Go back

Disable AdBlock Plus

Follow these easy steps to disable AdBlock Plus

1)Click on the icon in the browser’s toolbar.
2)Click on the toggle to disable it for "mrexcel.com".
Go back

Disable uBlock Origin

Follow these easy steps to disable uBlock Origin

1)Click on the icon in the browser’s toolbar.
2)Click on the "Power" button.
3)Click on the "Refresh" button.
Go back

Disable uBlock

Follow these easy steps to disable uBlock

1)Click on the icon in the browser’s toolbar.
2)Click on the "Power" button.
3)Click on the "Refresh" button.
Go back
Back
Top