Find last value in row that is not a percentage value

IanPM

Board Regular
Joined
Dec 12, 2013
Messages
53
A
B
C
D
E
F
G
H
I
J
K
L
M
N
1
Price 2017
Price 2018
Price 2019/01
Price change
Price 2019/02
Price change
Price 2019/03
Price change
Price 2019/04
Price change
Price 2019/05
Price change
Price 2019/06
Price change
2
20
22
23
4.5%
25
8.7%
25
0.0%
25
0.0%
3
20
22
0.0%
0.0%
0.0%
25
13.6%
4
5

<tbody>
</tbody>


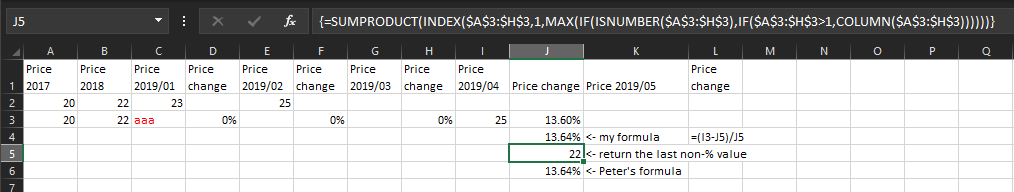
I need the price changes to calculate of the last price value. Data example
In Row 2 the price changed 4.5% from 2019/01 to 2018 & 8.7% in 2019/02 from 2019/01
In row 3 the first price change in column I - 2019/04 at 13.6%.

Question what formula can I use the find the last value which is 22 in 2018 (column B ) & exclude all the percentages?

Thank you

IanPM
 
Hi Ian,

A small edit to my original formula (I got inspired by Peter's answer):

Code:
=SUMPRODUCT(INDEX($A$3:$H$3,1,MAX(IF(ISNUMBER($A$3:$H$3),IF($A$3:$H$3>1,COLUMN($A$3:$H$3))))))

This is an array formula (Ctrl+Shift+Enter) and will also ignore text values. The final result looks like that:

B9SvuSW.png


Note that Peter's formula also ignores text values and returns the correct result.
 
Upvote 0

Excel Facts

Workdays for a market open Mon, Wed, Friday?
Yes! Use "0101011" for the weekend argument in NETWORKDAYS.INTL or WORKDAY.INTL. The 7 digits start on Monday. 1 means it is a weekend.
.. I get a name error.
Sounds like you must be using an older version of Excel. Try this one instead. It is an array formula so should be entered without the {} but confirmed with Ctrl+Shift+Enter, not just Enter. If confirmed correctly, Excel will insert the {}. The formula can then be copied down and then to the other 'Price change' columns.

Excel Workbook
ABCDEFGHIJK
1Price 2017Price 2018Price 2019/01Price changePrice 2019/02Price changePrice 2019/03Price changePrice 2019/04Price changePrice 2019/05
22022234.5%258.7%250.0%250.0%
320222513.6%
4
Price Change (2)
 
Upvote 0
Hi Peter

Almost perfect.
When the price increases or no change it takes the last value/correct value. However if the price decreases, the formula ignores the last price & continues to use the price before the decrease.
Do you have any suggestions? I assume some kid of MIN/IF statement is needed for decreases?
Sample data and expected result(s) would help. ;)
 
Upvote 0
A
B
C
D
E
F
G
H
I
J
K
L
1
Ref
Price
Price
Price
Formula result
Price
Formula result
Price
Formula result
Price
Formula result
Expected result
2
Ref
2017
2018
2019/01
Price change
2019/02
Price change
2019/03
Price change
2019/04
Price change
Price change
3
4
AAA
12
13
13
17
13
-23.5%
17
0.0%
30.8%
5
BBB
12
13
12
-7.7%
11
-15.4%
-8.3%
6
CCC
12
14
16.7%
17
21.4%
Ok
7
DDD
12
15
25.0
1
6.7%
Ok
8
EEE
0.50
0.40
-20.0%
0.60
70.0%
50.0
9

<tbody>
</tbody>

Hi Peter

I have some issues to get a file to you via Dropbox

However above table shows the data.
Rows 3,4 & 8 has price reductions up to 2019/03. In 2019/04 (column J) the prices changed but the percentage changes in in column K does not give correct percentages. The expected percentages is in column L

Rows 6 & 7 calculates correctly all the way through. Only difference no reductions in price.
 
Upvote 0
1. What version of Excel are you using?

2. How do you calculate that K7 should be 6.7%? My formula returns -93.3% and that seems logical as a reduction in price from 15 to 1.
 
Upvote 0
Hi Peter

1. Using Excel 2016

2 K7 in my file is 16 then 6.7%, but if 1 then yes -93.3%
 
Upvote 0
I haven't looked at the Dropbox file but I do have another question about the price fluctuating. What should each yellow cell here be & any relevant specifics of the calculation to get it?

Excel Workbook
BCDEFGHIJKLM
1PricePricePricePrice changePricePrice changePricePrice changePricePrice changePrice 2019/05Price change
2201720182019/012019/022019/032019/04
3
410201525104030
Sample
 
Upvote 0
Hi Peter

The yellow cell a straight calculation of the price change percentage from the current price to last / previous price. In the example you send each month has a price, which we o no have, but if this was the case & I use column M as reference then the formula would be L4/J4-1 (-25.0%).
 
Last edited:
Upvote 0

Forum statistics

Threads
1,214,588
Messages
6,120,412
Members
448,960
Latest member
AKSMITH

We've detected that you are using an adblocker.

We have a great community of people providing Excel help here, but the hosting costs are enormous. You can help keep this site running by allowing ads on MrExcel.com.
Allow Ads at MrExcel

Which adblocker are you using?

Disable AdBlock

Follow these easy steps to disable AdBlock

1)Click on the icon in the browser’s toolbar.
2)Click on the icon in the browser’s toolbar.
2)Click on the "Pause on this site" option.
Go back

Disable AdBlock Plus

Follow these easy steps to disable AdBlock Plus

1)Click on the icon in the browser’s toolbar.
2)Click on the toggle to disable it for "mrexcel.com".
Go back

Disable uBlock Origin

Follow these easy steps to disable uBlock Origin

1)Click on the icon in the browser’s toolbar.
2)Click on the "Power" button.
3)Click on the "Refresh" button.
Go back

Disable uBlock

Follow these easy steps to disable uBlock

1)Click on the icon in the browser’s toolbar.
2)Click on the "Power" button.
3)Click on the "Refresh" button.
Go back
Back
Top