Chart Help - 1 stacked column into 3

esmecat

New Member
Joined
May 5, 2010
Messages
19
Hi

I have been periodically creating a stacked column chart. This now has been divided in 3 sections and so the chart has to follow! I'm sure this should be really simple but I just cant seem to manage it. I eventually got it split into 3 by transposing the data but now I am missing P6 from my chart. I also don't know how to add the chart so you can see.

18/19 P12
18/19 P13
19/20 P1
19/20 P2
19/20 P3
19/20 P4
19/20 P5
19/20 P6
East Coast
New
46
37
0
0
46
56
13
0
Open (not overdue)
5
47
65
56
39
20
115
121
Overdue
7
3
5
8
7
10
17
29
Closed
-37
-21
-11
-7
-19
-8
-6
-1
Open (Total NCR's)
58
87
70
64
92
86
145
150
East Midlands
New
0
0
0
0
0
0
0
99
Open (not overdue)
89
82
72
56
44
20
34
0
Overdue
8
9
11
15
21
22
20
34
Closed
-30
-13
-8
-14
-4
-7
-4
-14
Open (Total NCR's)
97
91
83
71
65
42
54
133
North & East
New
17
0
0
0
0
0
0
0
Open (not overdue)
33
45
39
26
19
10
13
10
Overdue
0
2
2
0
2
2
0
1
Closed
-9
-10
-6
-17
-3
-5
-3
-2
Open (Total NCR's)
50
47
41
26
21
12
13
11
Total
New
105
37
0
0
46
56
13
99
Open (not overdue)
84
175
176
138
233
50
162
201
Overdue
17
16
18
23
30
34
37
64
Closed
-76
-44
-25
-38
-26
-20
-13
-17
Open (Total NCR's)
206
228
194
161
309
140
212
364

<tbody>
</tbody>
 

Excel Facts

Convert text numbers to real numbers
Select a column containing text numbers. Press Alt+D E F to quickly convert text to numbers. Faster than "Convert to Number"
that looks a chart if i've ever seen one
you can post data samples by clicking here and using any of the tools provided
we are still missing some vital information though:
- HOW do you want the chart transposed into 3?
- WHAT do you want the end result to look like?
- WHAT are the names of your sheets
- Is this chart all in one sheet? if so is the region (east coast, etc) column A?
 
Upvote 0
Hi

By chart I mean a stacked graph. Originally it would show a column split into new/closed/open/overdue for each period. I now need to show the same but 3 columns per period for east coast/East mids/North & east.
Limited due to work laptop but just want to share pic or attachment.
 
Upvote 0
I'm not an infographics guy but nows a good a time to learn as any
so to clarify you want 3 bars of the same datapoints?
how do i know where to split each period into 3's?
it seems pretty straightforward on how to add bars to a chat, are you needing help selecting the data or are you going for a dynamic graph that constantly changes?
i'm still missing a lot of info to help you. it's fine to be "overly" hyper specific.

Edit: which my questions are still pretty relevant even after seeing your /actual/ chart

perhaps this article is all you need?
https://computer.howstuffworks.com/how-to-make-bar-graph-in-excel.htm
 
Last edited:
Upvote 0
my blind attempt would be to right click your chart and where it says "Select Data.."
it will open a window where you can change the values of your axiis' and select/add data ranges
i can't tell you what and where to add because i don't know how you want this data split
 
Upvote 0


Hi

I have already split the data into 3 now from the total and these are shown asEast Coast Data, East Mids Data and North & East data. I no longer need tograph the total but do need it split as per my diagram. The chart is prettymuch how I want it – its taken a long time to get to this – but its missing aperiod on the end (p6) and I can’t figure out why.


I am also open to a better/more efficient way to do it.
 
Upvote 0
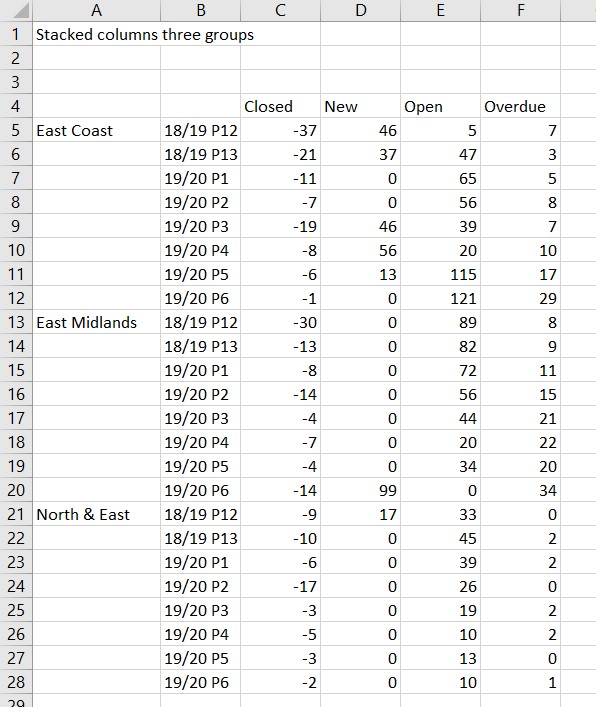
By setting up the graph data table you can make this type of graph much easier to create. To get a two-level category axis and the data series in the order you show, here is the data table:
Stacked-column-3-groups-Sep-18-2019-data-table.jpg


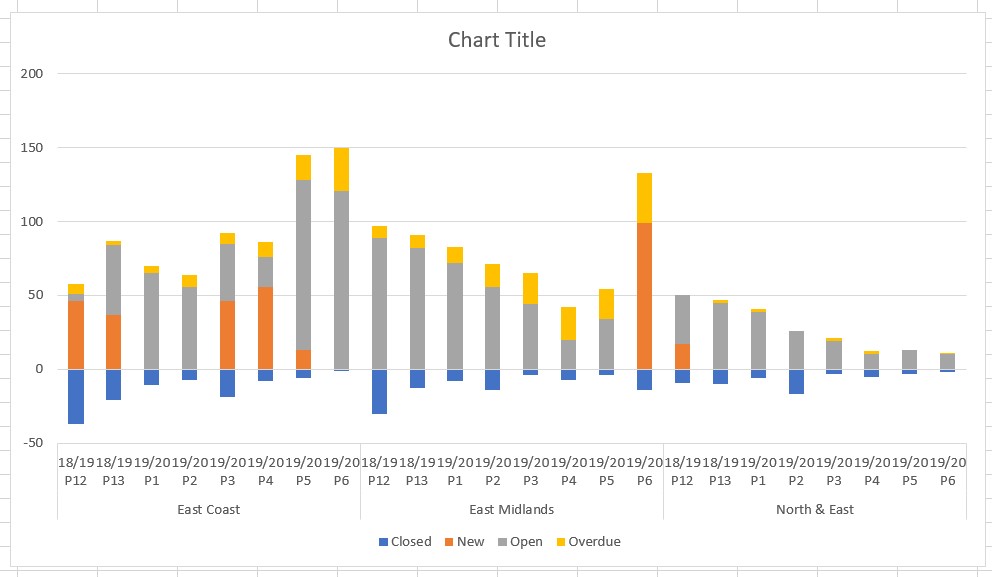
Select cells A4 to F28 and insert a stacked column chart. The chart will look like this:
Stacked-column-3-groups-Sep-18-2019-chart.jpg


Now you just need to add the data labels to each data series.

Hope that helps.
 
Upvote 0

Forum statistics

Threads
1,214,430
Messages
6,119,442
Members
448,898
Latest member
drewmorgan128

We've detected that you are using an adblocker.

We have a great community of people providing Excel help here, but the hosting costs are enormous. You can help keep this site running by allowing ads on MrExcel.com.
Allow Ads at MrExcel

Which adblocker are you using?

Disable AdBlock

Follow these easy steps to disable AdBlock

1)Click on the icon in the browser’s toolbar.
2)Click on the icon in the browser’s toolbar.
2)Click on the "Pause on this site" option.
Go back

Disable AdBlock Plus

Follow these easy steps to disable AdBlock Plus

1)Click on the icon in the browser’s toolbar.
2)Click on the toggle to disable it for "mrexcel.com".
Go back

Disable uBlock Origin

Follow these easy steps to disable uBlock Origin

1)Click on the icon in the browser’s toolbar.
2)Click on the "Power" button.
3)Click on the "Refresh" button.
Go back

Disable uBlock

Follow these easy steps to disable uBlock

1)Click on the icon in the browser’s toolbar.
2)Click on the "Power" button.
3)Click on the "Refresh" button.
Go back
Back
Top