Hi
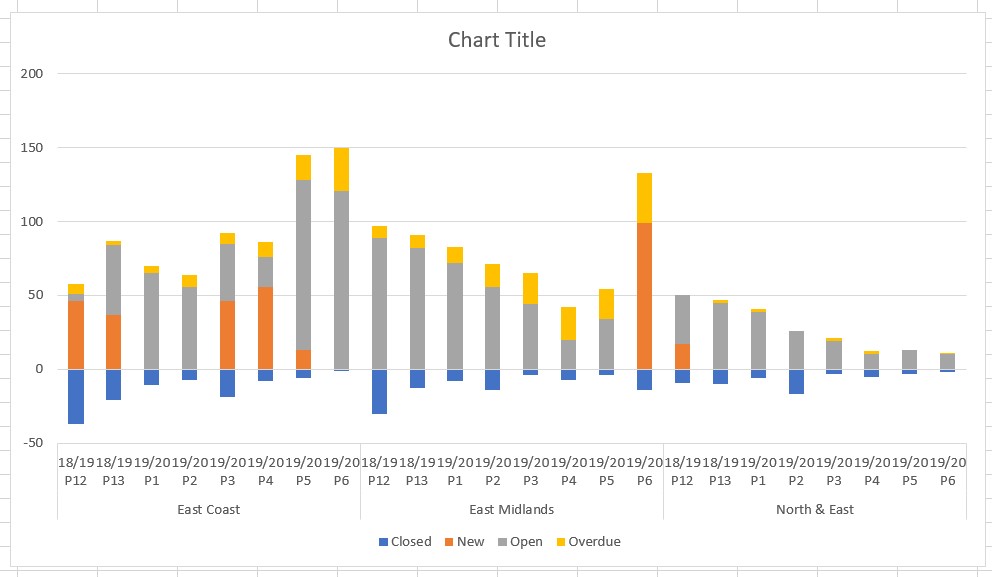
I have been periodically creating a stacked column chart. This now has been divided in 3 sections and so the chart has to follow! I'm sure this should be really simple but I just cant seem to manage it. I eventually got it split into 3 by transposing the data but now I am missing P6 from my chart. I also don't know how to add the chart so you can see.
<tbody>
</tbody>
I have been periodically creating a stacked column chart. This now has been divided in 3 sections and so the chart has to follow! I'm sure this should be really simple but I just cant seem to manage it. I eventually got it split into 3 by transposing the data but now I am missing P6 from my chart. I also don't know how to add the chart so you can see.
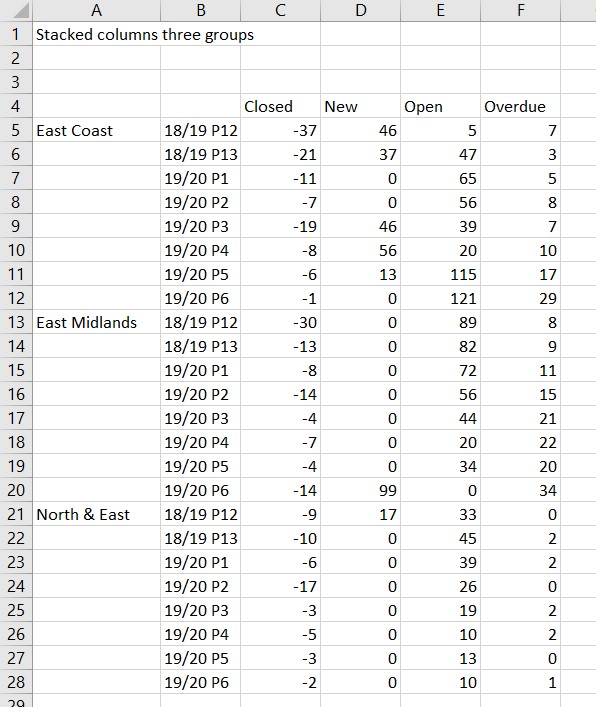
| 18/19 P12 | 18/19 P13 | 19/20 P1 | 19/20 P2 | 19/20 P3 | 19/20 P4 | 19/20 P5 | 19/20 P6 | ||
| East Coast | |||||||||
| New | 46 | 37 | 0 | 0 | 46 | 56 | 13 | 0 | |
| Open (not overdue) | 5 | 47 | 65 | 56 | 39 | 20 | 115 | 121 | |
| Overdue | 7 | 3 | 5 | 8 | 7 | 10 | 17 | 29 | |
| Closed | -37 | -21 | -11 | -7 | -19 | -8 | -6 | -1 | |
| Open (Total NCR's) | 58 | 87 | 70 | 64 | 92 | 86 | 145 | 150 | |
| East Midlands | |||||||||
| New | 0 | 0 | 0 | 0 | 0 | 0 | 0 | 99 | |
| Open (not overdue) | 89 | 82 | 72 | 56 | 44 | 20 | 34 | 0 | |
| Overdue | 8 | 9 | 11 | 15 | 21 | 22 | 20 | 34 | |
| Closed | -30 | -13 | -8 | -14 | -4 | -7 | -4 | -14 | |
| Open (Total NCR's) | 97 | 91 | 83 | 71 | 65 | 42 | 54 | 133 | |
| North & East | |||||||||
| New | 17 | 0 | 0 | 0 | 0 | 0 | 0 | 0 | |
| Open (not overdue) | 33 | 45 | 39 | 26 | 19 | 10 | 13 | 10 | |
| Overdue | 0 | 2 | 2 | 0 | 2 | 2 | 0 | 1 | |
| Closed | -9 | -10 | -6 | -17 | -3 | -5 | -3 | -2 | |
| Open (Total NCR's) | 50 | 47 | 41 | 26 | 21 | 12 | 13 | 11 | |
| Total | |||||||||
| New | 105 | 37 | 0 | 0 | 46 | 56 | 13 | 99 | |
| Open (not overdue) | 84 | 175 | 176 | 138 | 233 | 50 | 162 | 201 | |
| Overdue | 17 | 16 | 18 | 23 | 30 | 34 | 37 | 64 | |
| Closed | -76 | -44 | -25 | -38 | -26 | -20 | -13 | -17 | |
| Open (Total NCR's) | 206 | 228 | 194 | 161 | 309 | 140 | 212 | 364 |
<tbody>
</tbody>
")