I rarely post questions on here as I've so often been able to find posts on how to solve my problem. In this case, I'm struggling. I want to chart data based on the selection of a Store. How do I do this?
<colgroup><col><col><col><col><col></colgroup><tbody>
</tbody>
<colgroup><col><col><col><col><col span="2"><col span="3"></colgroup><tbody>
</tbody>
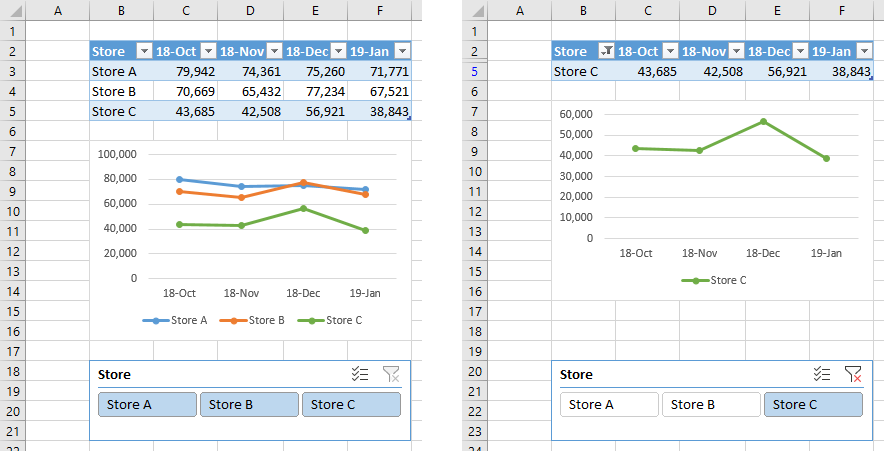
| Gross Sales | Oct-18 | Nov-18 | Dec-18 | Jan-19 |
| Store A | 79,942 | 74,361 | 75,260 | 71,771 |
| Store B | 70,669 | 65,432 | 77,234 | 67,521 |
| Store C | 43,685 | 42,508 | 56,921 | 38,843 |
<colgroup><col><col><col><col><col></colgroup><tbody>
</tbody>
<colgroup><col><col><col><col><col span="2"><col span="3"></colgroup><tbody>
</tbody>