I have two data series, showing the ranking of a number of factors before and after a vote.
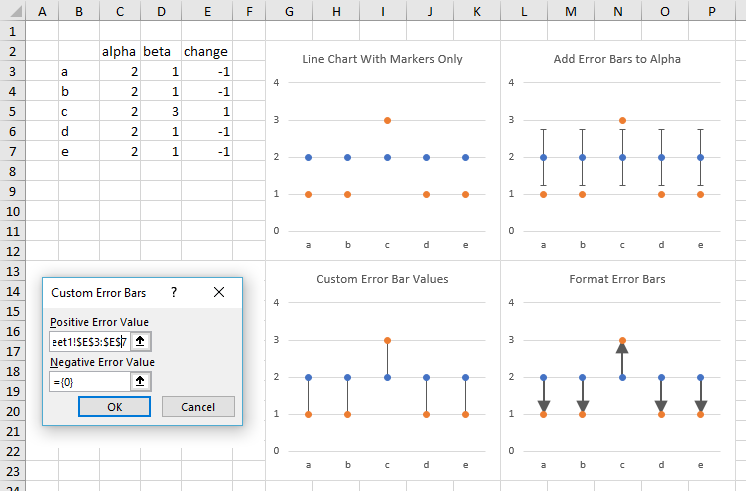
I want to show how the position of each factor changes after the vote. So far, I have put on high-low lines, which links the relevant points clearly. However, I want them to be arrows, always pointing from one series to the other, regardless of whether it moves higher or lower.
At the moment, I can only add arrow heads in one direction (up or down).
Does anyone know a way of adding appropriate arrows?
My table is set out:
<tbody>
</tbody>
I want the arrows to always point from the pre-vote data set to the post-vote data set, regardless of whether it's an increase or decrease.
Any help very much appreciated.
Caitlin
I want to show how the position of each factor changes after the vote. So far, I have put on high-low lines, which links the relevant points clearly. However, I want them to be arrows, always pointing from one series to the other, regardless of whether it moves higher or lower.
At the moment, I can only add arrow heads in one direction (up or down).
Does anyone know a way of adding appropriate arrows?
My table is set out:
| Factor | Pre-vote rank position | Post-vote rank position |
| A | 1 | 3 |
| B | 5 | 6 |
| C | 7 | 4 |
| D | 10 | 2 |
<tbody>
</tbody>
I want the arrows to always point from the pre-vote data set to the post-vote data set, regardless of whether it's an increase or decrease.
Any help very much appreciated.
Caitlin