Chart Connect Points Drawing Shapes Peltier

doriangrey

Board Regular
Joined
Jan 18, 2012
Messages
57
Excel Vba Shapes to Connect Points Charts and make Drawing Clone of Complex Chart XY with Lines


Hi, Partners,
I using Jhon Peltier code to draw in charts,


I want connect the point of chart XY to create a shape clone of chart of 2 ways, 1solid line shape and 1Outline Shape.


the code works with more simplex charts but no with my complex chart.
i need change your "Dim as Integer" to "Dim as Long" to works with more simplex.


i need change the location of "Next" before "ConverToShape" to final of code to avoid the problem of shape close before a correct moment.


https://groups.google.com/forum/#!searchin/microsoft.public.excel.charting/nodes$20points%7Csort:relevance/microsoft.public.excel.charting/AgWMOIKU4Do/w1JYa3PIt5kJ


the chart (XY Scatter dots only) have 1series with very number of points with contiguous and non-contiguous points complex design.


Excel 2013 32bit Original - Win7.


please work with my sample file logo if possible.

https://mega.nz/#!RxRV0QSR!uHzNTAOIbzJqyN3igXlGxxbSxlKrR2xV1XlQ_h2IxVk

Code:
[COLOR=#333333][FONT=source_sans_proregular]https://mega.nz/#!RxRV0QSR!uHzNTAOIbzJqyN3igXlGxxbSxlKrR2xV1XlQ_h2IxVk
[/FONT][/COLOR]


thank you very mutch.
DorianGrey

 
This should not take long to run. Perhaps all the blank cells included in the chart data causes this.

You keep wanting to run the code on bad data, then eliminate some of the lines that are produced. You need to use the right data. I got the data in my example by lookint at your many points, and deciding where I needed a few points to define the borders of the shape.

If you know what points you do need, then make a new data set, copy these values from the old data set and paste them into the new one. Then see if the new data set draws the series you need.

I don't think looping to every third point (or whatever) is going to do what you need, because the number of excess points varies throughout the data set, and the points still will not be in the proper order to define an outline.
 
Upvote 0

Excel Facts

What does custom number format of ;;; mean?
Three semi-colons will hide the value in the cell. Although most people use white font instead.
Jhon,

i fixed the blank cells of the range of data of chart.

but i can not automatically find the right coords of range i need (scanning automated), other than looping (vba) on the points of chart, as your code does.

These coordinates are correct because they are the black pixels of the image I scanned, except that they produce 3 separate nodes (3points) and not just 1 single point, since they are the amount of black pixels of each part of the drawing.

I'm trying to make an automated process, I do not know which Range coordinates are the ones that will produce each point in the chart and which ones I can delete, I do not know how you did it, but if you did it just by looking with your eyes, then no. Works fine for me, I need to do this with a VBA routine.

I will create a drawing and a sample file demonstrating if I can.
Maybe for you this is not interesting, but I think it's the most logical idea to use your algorithm to create drawings from scanned images in a more automated way.

I do not know if you actually saw the last Screenshot and read my last post in this forum.

You could play more with my last sample file 13.3mb because it is very interesting and fast, and I think you might be interested if you calmly examine the shapes produced.


In both the results show me that it is possible to use the current coordinates, what I need is to do the correct looping through the correct points of the chart, look to drawings into workbook. The Large Red SupermanLogo is a shape with Nodes in EditNodes mode, the same Large Blue Shape if i am make with your code.

but i am will play with new coords of this scanned image in the next days. I am have worked hard with shapes in last 1one year.

need more patience to examine the results in detail (enlarge each shapes and view the nodes), look at changes in the VBACodes, and not just look at the screenshot. Are importants revelations in each shapes and changes in this workbooks i am created.

I know that you are very busy and a great expert.
I appreciate all your attention that you dedicated me.

thank you very much.

fe78a3af32e251b86c6a91b5423b938e.png
 
Last edited:
Upvote 0
"These coordinates are correct because ..."

Do these coordinates trace the outlines of the shape? No, they are the coordinates of grid coordinates that fall within the shape, not in the outline of the shape. So these coordinates are not correct, and no amount of looping and skipping a few will reliably make use of them.
 
Upvote 0
Jhon,

in my mind i think all time about "dots" and not lines, plot dots works, lines not with the your code "ORiginal", but "modified" i think will work.

but i will play more with new coordinates tomorrow, this moment is night here now and i will sleep in next 2hours.

i previous sent to you the Link to my sample file with 15mb.

Jhon, if you correct, and my coords wrong, you think about the your modified HerberVersionCode make this result??

look at the points 1o (88,38) and 2o (88,39) (no 1one points only, 2points) in contour line (ploted diagonal) .
i think i need connect points 88 to 89 etc and not, not 88.x to 88.y etc.

but i will play more with new coordinates tomorrow.

thanks, Jhon.

edit: i think i need a "Circular Looping" and not "Diagonal Looping" of nodePoints (xNode, Ynode, nextNode, previousNode)

c4ab94d323f63928fe3d3613d559c2c0.png
2b4b10b2a2c9f342ecf3d7221dda6d12.png


Code:
Sub LinesXYPeltierHerberXman1()
    Dim myCht As Chart
    Dim mySrs As Series
    'Dim Npts As Integer, Ipts As Integer 
    Dim Npts As Long, Ipts As Long
    Dim myBuilder As FreeformBuilder
    Dim myShape As Shape
    Dim Xnode As Double, Ynode As Double
    Dim Xmin As Double, Xmax As Double
    Dim Ymin As Double, Ymax As Double
    Dim Xleft As Double, Ytop As Double
    Dim Xwidth As Double, Yheight As Double
          
         
      'Set myCht = ActiveSheet.ChartObjects("grafico1").Chart
               Set myCht = ActiveSheet.ChartObjects("graficoHerber").Chart


    'Set myCht = ActiveChart
    Xleft = myCht.PlotArea.InsideLeft
    Xwidth = myCht.PlotArea.InsideWidth
    Ytop = myCht.PlotArea.InsideTop
    Yheight = myCht.PlotArea.InsideHeight
    Xmin = myCht.Axes(1).MinimumScale
    Xmax = myCht.Axes(1).MaximumScale
    Ymin = myCht.Axes(2).MinimumScale
    Ymax = myCht.Axes(2).MaximumScale
    
    Set mySrs = myCht.SeriesCollection(1)
    Npts = mySrs.Points.Count
    
    For Ipts = 1 To Npts
        ' Anfangspunkt der Linie
        Xnode = Xleft + (mySrs.XValues(Ipts) - Xmin) * Xwidth / (Xmax - Xmin)
        Ynode = Ytop + (Ymax - mySrs.Values(Ipts)) * Yheight / (Ymax - Ymin)
        Set myBuilder = myCht.Shapes.BuildFreeform(msoEditingAuto, Xnode, Ynode)
        ' Endpunkt der Linie (zum testen erstmal einfach X&Y +10)
        myBuilder.AddNodes msoSegmentLine, msoEditingAuto, Xnode + 10, Ynode + 10
        ' Linie zeichnen
        Set myShape = myBuilder.ConvertToShape
        myShape.Line.ForeColor.SchemeColor = 10
        Set myBuilder = Nothing
    Next
   
End Sub
 
Last edited:
Upvote 0
As long as you refuse to realize that your points are not the coordinates needed to trace the outlines of your shapes, you will not get what you want.

The procedure does not loop in a diagonal or in a circular fashion. The procedure loops from the first point to the last. It is the order of points that gives the appearance of the output.

What is different about this latest code you've posted that you think will make incorrect points plot correctly?
 
Upvote 0
Jhon,


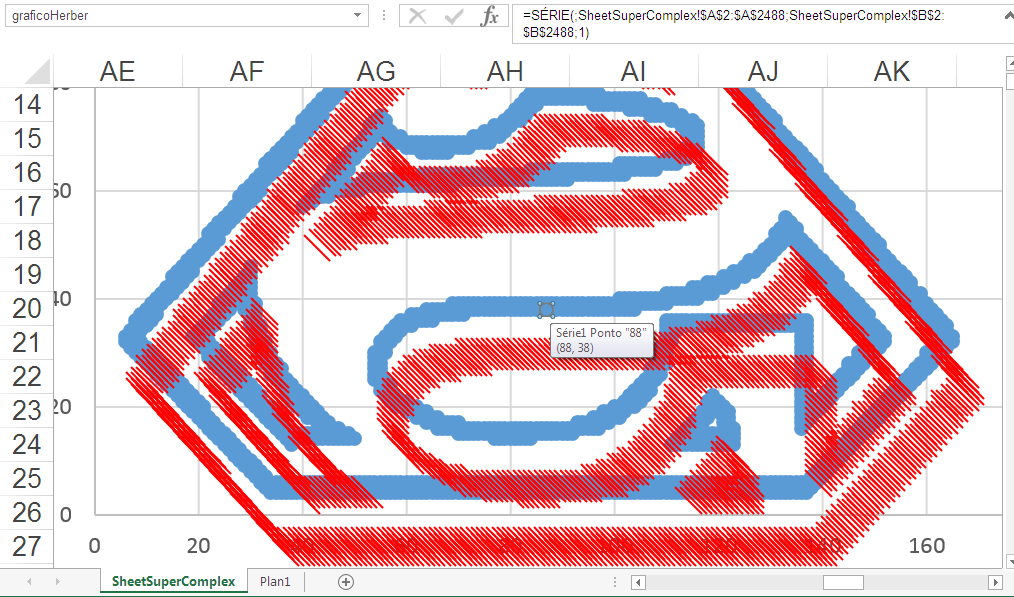
I'm checking my image scanning algorithm with GetPixel, I'm going to test new coordinates.

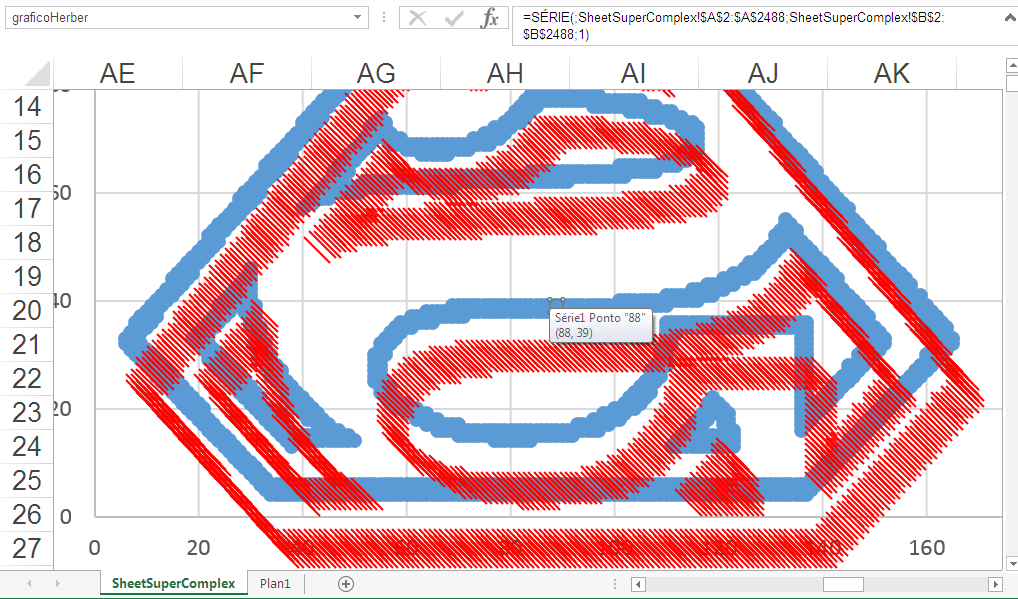
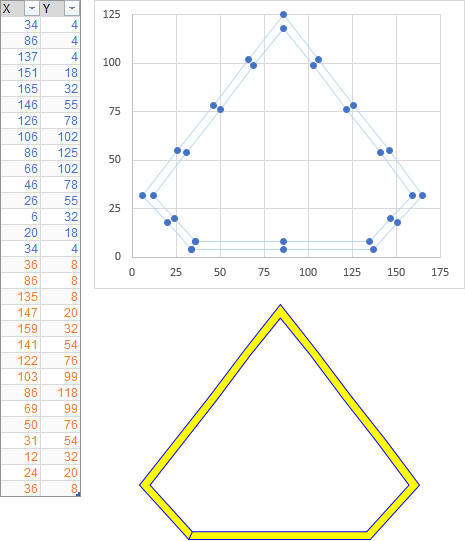
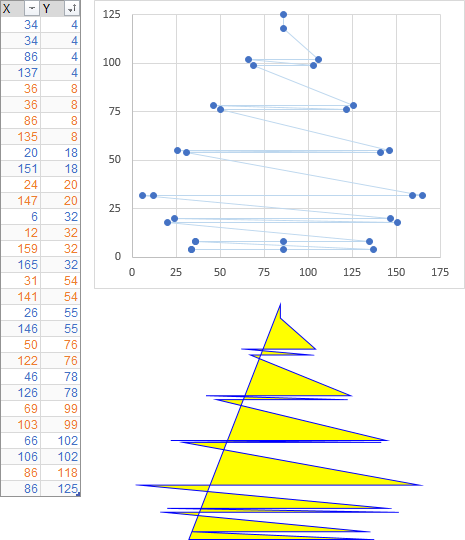
Yes, only today I understood that the order in which coordinates are in the list makes a difference, not just the numbers of x / y.

But I would not want to have to delete from the Worsheet cells and not even from the chart the coordinates and not even the point (nodes).


"The procedure does not loop in a diagonal or in a circular fashion. The procedure loops from the first point to the last."


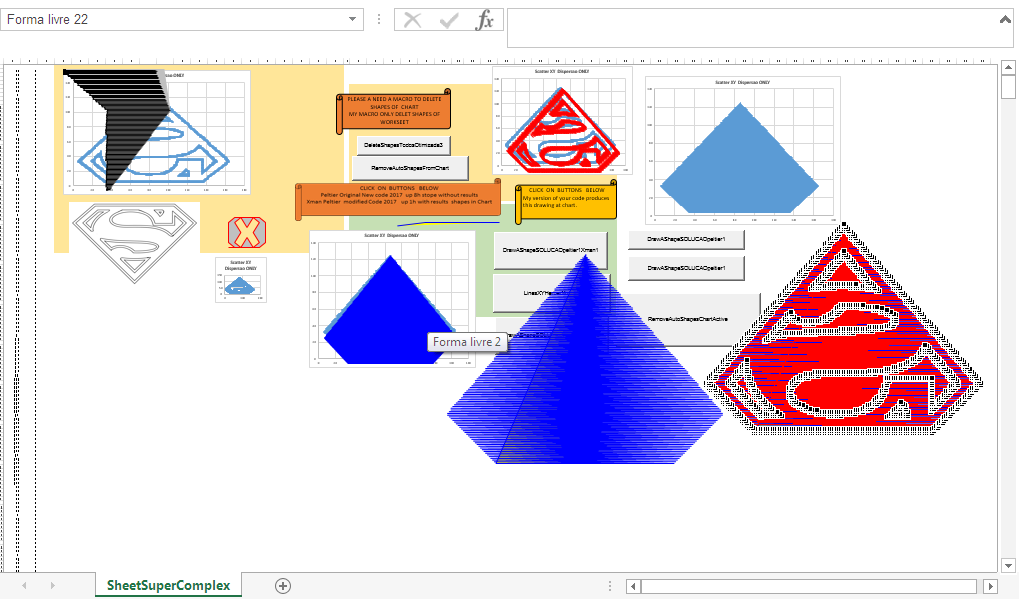
I want to first try to create an algorithm to use only the x / y coords of the desired Points (nondes of Chart) when using BuildFreeFormAddLines, so FreeFormBuilder will ignore the CoordsXY that do not satisfy the condition.


This way I will have in the Chart the original drawing and I will have in Shape the created drawing.

I believe this problem is the same as always when trying to create a drawing with Lines when the coordinates are for points.
====================================================
http://dailydoseofexcel.com/blogpix/mapstate2.gif
http://www.clearlyandsimply.com/.a/6a00e554d9fb99883301bb081f0cec970d-pi
Reading XML Files in VBA – Daily Dose of Excel
Create Excel Freeform Shapes from Polygons - Clearly and Simply

6a00e554d9fb99883301b7c77b13e3970b-pi


6a00e554d9fb99883301bb081f0cec970d-pi


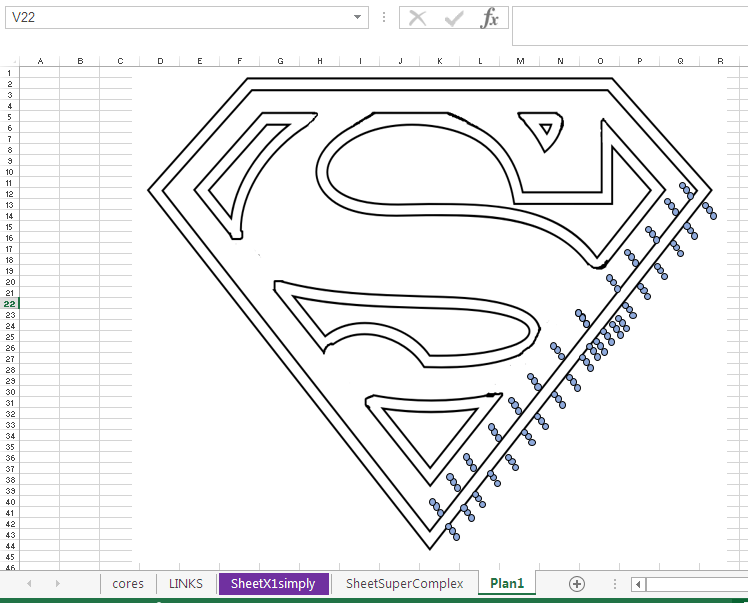
I do not want to create a filled shape, I want to create a leaked shape or the best it can be.

I believe it is possible to play with the XNode and YNode values ​​with "If XNode = 'valueX' and Ynode = 'valueY then AddNodes'


I am already testing new coordinates but I do not know if they are correct and I can not adapt their code alone, but I believe that their code is the basis for the new algorithm.


Do you have some workbook example scanned the colors of the pixels of an image with GetPIxel method and put in a list of 2 XY columns as it is in my spreadsheet and that works in your code to create the shape drawing?

==================================================================

I want make a code shomething like this "PSEUDOCODE" :
---------------------------------------------------------------------
For Ipts = 1 To Npts


"................"

If Xnode = "VALUE" And Ynode = "VALUE"

myBuilder.AddNodes msoSegmentLine, msoEditingAuto, Xnode, Ynode


Set myShape = myBuilder.ConvertToShape
myShape.Line.ForeColor.SchemeColor = 10
Set myBuilder = Nothing

End If


Next
=============================================================


Jhon, Please, Look at this version of your code from HerberForum i think:

Code:
Option Explicit


Sub ShadeBelow()
      Dim myCht As Chart
      Dim mySrs As Series
'Dim Npts As Integer, Ipts As Integer
            Dim Npts As Long, Ipts As Long
      Dim myBuilder As FreeformBuilder
      Dim myShape As Shape
      Dim Xnode As Double, Ynode As Double
      Dim Xmin As Double, Xmax As Double
      Dim Ymin As Double, Ymax As Double
      Dim Xleft As Double, Ytop As Double
      Dim Xwidth As Double, Yheight As Double
      Dim NullNachMax As Integer
      Dim Y_Value As Double, Y_Value_1 As Double
      Dim X_Value As Double, X_Value_1 As Double
      'If ActiveSheet.Type = xlWorksheet Then
        'MsgBox "Bitte vor Start des Makros ein XY-Punkt-Diagramm aktivieren!"
      'Exit Sub
      'End If
      'Set myCht = ActiveChart
      Set myCht = ActiveSheet.ChartObjects("grafico1").Chart
      'Call Shape_LoescheninChart(objSheet:=myCht)
      
      Xleft = myCht.PlotArea.InsideLeft
      Xwidth = myCht.PlotArea.InsideWidth
      Ytop = myCht.PlotArea.InsideTop
      Yheight = myCht.PlotArea.InsideHeight
      Xmin = myCht.Axes(1).MinimumScale
      Xmax = myCht.Axes(1).MaximumScale
      Ymin = myCht.Axes(2).MinimumScale
      Ymax = myCht.Axes(2).MaximumScale
    
      Set mySrs = myCht.SeriesCollection(1)
      Npts = mySrs.Points.Count


      ' first point
      If mySrs.XValues(1) > Xmax Then
        NullNachMax = 2 'die ersten X-Werte sind >Xmax
       Xnode = Xleft + (Xmax - Xmin) * Xwidth / (Xmax - Xmin)
       Ynode = Ytop + Yheight
       Set myBuilder = myCht.Shapes.BuildFreeform(msoEditingAuto, Xnode, Ynode)
      Else
        NullNachMax = 1 'die letzten X-Werte sind >Xmax
      ' first point
       Xnode = Xleft + (mySrs.XValues(1) - Xmin) * Xwidth / (Xmax - Xmin)
      
       Ynode = Ytop + Yheight
       Set myBuilder = myCht.Shapes.BuildFreeform(msoEditingAuto, Xnode, Ynode)
      End If
      ' remaining points
      For Ipts = 1 To Npts
        Y_Value = mySrs.Values(Ipts)
        X_Value = mySrs.XValues(Ipts)
        If Y_Value < Ymin Then
          Y_Value = Ymin
        End If
        If Ipts > 1 Then
          X_Value_1 = mySrs.XValues(Ipts - 1)
          Y_Value_1 = mySrs.Values(Ipts - 1)
          If Y_Value_1 < Ymin Then Y_Value_1 = Ymin
        End If
        If NullNachMax = 1 Then 'die letzten X-Werte sind > Xmax
          If X_Value > Xmax Then
            Xnode = Xleft + (Xmax - Xmin) * Xwidth / (Xmax - Xmin)
            Ynode = Ytop + (Ymax - (Y_Value_1 _
              + (Y_Value - Y_Value_1) / (X_Value - X_Value_1) * (Xmax - X_Value_1))) _
              * Yheight / (Ymax - Ymin)
            myBuilder.AddNodes msoSegmentLine, msoEditingAuto, Xnode, Ynode
            Exit For
          Else
            Xnode = Xleft + (X_Value - Xmin) * Xwidth / (Xmax - Xmin)
            Ynode = Ytop + (Ymax - Y_Value) * Yheight / (Ymax - Ymin)
            myBuilder.AddNodes msoSegmentLine, msoEditingAuto, Xnode, Ynode
          End If
        ElseIf NullNachMax = 2 Then 'die ersten X-Werte sind > Xmax
          Do Until X_Value < Xmax
            Ipts = Ipts + 1
            X_Value = mySrs.XValues(Ipts)
            Y_Value = mySrs.Values(Ipts)
          Loop
          If Y_Value < Ymin Then Y_Value = Ymin
          X_Value_1 = mySrs.XValues(Ipts - 1)
          Y_Value_1 = mySrs.Values(Ipts - 1)
          If Y_Value_1 < Ymin Then Y_Value_1 = Ymin
          Xnode = Xleft + (Xmax - Xmin) * Xwidth / (Xmax - Xmin)
          Ynode = Ytop + (Ymax - (Y_Value_1 _
            + (Y_Value - Y_Value_1) / (X_Value - X_Value_1) * (Xmax - X_Value_1))) _
            * Yheight / (Ymax - Ymin)
          myBuilder.AddNodes msoSegmentLine, msoEditingAuto, Xnode, Ynode
          NullNachMax = 0
        ElseIf NullNachMax = 0 Then
          Xnode = Xleft + (X_Value - Xmin) * Xwidth / (Xmax - Xmin)
          Ynode = Ytop + (Ymax - Y_Value) * Yheight / (Ymax - Ymin)
          myBuilder.AddNodes msoSegmentLine, msoEditingAuto, Xnode, Ynode
        End If
      Next
      If Ipts > Npts Then
        'alle Punkte der Kurve im Diagramm
        Xnode = Xleft + (mySrs.XValues(Npts) - Xmin) * Xwidth / (Xmax - Xmin)
        Ynode = Ytop + Yheight
      Else
        'Skalen-Max-Wert ist kleiner als der größte X-Wert
        Xnode = Xleft + (Xmax - Xmin) * Xwidth / (Xmax - Xmin)
        Ynode = Ytop + Yheight
      End If
      myBuilder.AddNodes msoSegmentLine, msoEditingAuto, Xnode, Ynode
    
      Xnode = Xleft + (mySrs.XValues(1) - Xmin) * Xwidth / (Xmax - Xmin)
      Ynode = Ytop + Yheight
      myBuilder.AddNodes msoSegmentLine, msoEditingAuto, Xnode, Ynode
    
      Set myShape = myBuilder.ConvertToShape
    
      With myShape
      ' USE YOUR FAVORITE COLORS HERE
        .Fill.ForeColor.SchemeColor = 12
        .Line.Visible = False
      End With
    
End Sub
''=====================================
'Sub Shape_LoescheninChart(Optional objSheet As Object, Optional lngType As Long = 5)
  '''Type = 5 = Freihandform
 ' Dim objShape As Shape
  'If objSheet Is Nothing Then Set objSheet = ActiveSheet
 ' For Each objShape In objSheet.Shapes
    'With objShape
     ' If .Type = lngType Then
        '.Delete
        'Exit Sub
      'End If
    'End With
  'Next
'Ende:
  'Set objShape = Nothing
'End Sub


''=====================================

DETAIL OF HERBERFORUM VERSION OF JHON PELTIER CODE USING "IF" :

Code:
      ' first point
      If mySrs.XValues(1) > Xmax Then
        NullNachMax = 2 'die ersten X-Werte sind >Xmax
       Xnode = Xleft + (Xmax - Xmin) * Xwidth / (Xmax - Xmin)
       Ynode = Ytop + Yheight
       Set myBuilder = myCht.Shapes.BuildFreeform(msoEditingAuto, Xnode, Ynode)
      Else
        NullNachMax = 1 'die letzten X-Werte sind >Xmax
      ' first point
       Xnode = Xleft + (mySrs.XValues(1) - Xmin) * Xwidth / (Xmax - Xmin)
      
       Ynode = Ytop + Yheight
       Set myBuilder = myCht.Shapes.BuildFreeform(msoEditingAuto, Xnode, Ynode)
      End If
      ' remaining points
      For Ipts = 1 To Npts
        Y_Value = mySrs.Values(Ipts)
        X_Value = mySrs.XValues(Ipts)
        If Y_Value < Ymin Then
          Y_Value = Ymin
        End If
        If Ipts > 1 Then
          X_Value_1 = mySrs.XValues(Ipts - 1)
          Y_Value_1 = mySrs.Values(Ipts - 1)
          If Y_Value_1 < Ymin Then Y_Value_1 = Ymin
        End If
        If NullNachMax = 1 Then 'die letzten X-Werte sind > Xmax
          If X_Value > Xmax Then
            Xnode = Xleft + (Xmax - Xmin) * Xwidth / (Xmax - Xmin)
            Ynode = Ytop + (Ymax - (Y_Value_1 _
              + (Y_Value - Y_Value_1) / (X_Value - X_Value_1) * (Xmax - X_Value_1))) _
              * Yheight / (Ymax - Ymin)
            myBuilder.AddNodes msoSegmentLine, msoEditingAuto, Xnode, Ynode
            Exit For
          Else
            Xnode = Xleft + (X_Value - Xmin) * Xwidth / (Xmax - Xmin)
            Ynode = Ytop + (Ymax - Y_Value) * Yheight / (Ymax - Ymin)
            myBuilder.AddNodes msoSegmentLine, msoEditingAuto, Xnode, Ynode
          End If
        ElseIf NullNachMax = 2 Then 'die ersten X-Werte sind > Xmax
          Do Until X_Value < Xmax
            Ipts = Ipts + 1
            X_Value = mySrs.XValues(Ipts)
            Y_Value = mySrs.Values(Ipts)
          Loop
          If Y_Value < Ymin Then Y_Value = Ymin
          X_Value_1 = mySrs.XValues(Ipts - 1)
          Y_Value_1 = mySrs.Values(Ipts - 1)
          If Y_Value_1 < Ymin Then Y_Value_1 = Ymin
          Xnode = Xleft + (Xmax - Xmin) * Xwidth / (Xmax - Xmin)
          Ynode = Ytop + (Ymax - (Y_Value_1 _
            + (Y_Value - Y_Value_1) / (X_Value - X_Value_1) * (Xmax - X_Value_1))) _
            * Yheight / (Ymax - Ymin)
          myBuilder.AddNodes msoSegmentLine, msoEditingAuto, Xnode, Ynode
          NullNachMax = 0
        ElseIf NullNachMax = 0 Then
          Xnode = Xleft + (X_Value - Xmin) * Xwidth / (Xmax - Xmin)
          Ynode = Ytop + (Ymax - Y_Value) * Yheight / (Ymax - Ymin)
          myBuilder.AddNodes msoSegmentLine, msoEditingAuto, Xnode, Ynode
        End If
      Next
      If Ipts > Npts Then
        'alle Punkte der Kurve im Diagramm
        Xnode = Xleft + (mySrs.XValues(Npts) - Xmin) * Xwidth / (Xmax - Xmin)
        Ynode = Ytop + Yheight
      Else
        'Skalen-Max-Wert ist kleiner als der größte X-Wert
        Xnode = Xleft + (Xmax - Xmin) * Xwidth / (Xmax - Xmin)
        Ynode = Ytop + Yheight
      End If
      myBuilder.AddNodes msoSegmentLine, msoEditingAuto, Xnode, Ynode
    
      Xnode = Xleft + (mySrs.XValues(1) - Xmin) * Xwidth / (Xmax - Xmin)
      Ynode = Ytop + Yheight
      myBuilder.AddNodes msoSegmentLine, msoEditingAuto, Xnode, Ynode
    
      Set myShape = myBuilder.ConvertToShape
 
Last edited:
Upvote 0
Jhon, do you have some workbook example of scanning the colors of the pixels of an image with GetPIxel method and put in a list of 2 XY columns as it is in my spreadsheet and that works in your code to create the chart and the shapes drawings of chart ?


i need put the colors in 2 columns XY like my version workbook sample file. I want put 1one color like Black pixels, and other version with all collors.

my scanning algorithm GexPixel produces multiple points 1 one for each pixel, and produces the "contour line" with multiple "dots" , like 1one dot LeftExternal, one dot Internal and 1one dot RightExternal of the Contour.

each "dot" (node point) is one black pixel of the "contour line" of image.

Like this.


fc0ecaa0548660c76688b6882516eae3.png


My Image Scanning Code for Black Pixels Color


Code:
'=============================


m = 1
For yPos = 0 To sBitmapInfo.bmHeight - 1


    For xPos = 0 To sBitmapInfo.bmWidth - 1
        lRGB = GetPixel(lBMDC, xPos, yPos)
                
        getRGB lRGB, intR, intG, intB
        totalR = totalR + intR
        totalG = totalG + intG
        totalB = totalB + intB
'=============================
'''[0 BLACK COLOR]


 If lRGB = 0 Then m = m + 1


 If lRGB = 0 Then Cells(m, 1) = xPos


 If lRGB = 0 Then Cells(m, 2) = yPos
  
    If lRGB = 0 Then Cells(m, 3) = lRGB
'=============================
[COLOR=#333333]
[/COLOR]

 
Last edited:
Upvote 0
The code does work on the data in your chart, just not the way you think it should. The problem is that your data does not work for your purpose.

First, your data has many more points than you need. There more points than necessary to define the straight lines. Also, there are points within the region that you want shaded. It is as if the points were not defined by the outline of the shapes, but by which points in a fine grid fell within the shaded regions. It's like it is the needlepoint pattern to make the design. You may be able to use some of your points, but you have to delete the unneeded ones. You also have to put the points in the right order to trace the outline of the shape, as I described in my previous post.

Here is the first set of data in my post, with some intermediate points added to illustrate the sorting problem with your data. My data are sorted to trace the outline of the shape I want, shown by the markers and the lines connecting the markers. The chart looks fine, and when my program makes the shape, it draws it as expected, because it follows the paths of the connecting lines, because that is the order of points in the series.

ogqvPoo.png


Here is the exact same data, except as in your data set, it is sorted first by X (left to right in the chart) and then by Y (bottom to top). The points are all in the same places, and if I had turned off the display of the lines, you would not have known the difference. However, with the connecting lines visible, you can see that the points are not ordered to trace a nice outline. When I run the program, it connects all the right points, but in the wrong order, so the nice outline is not present.

This is why your data does not work.

zXaropZ.png


You need to sit down and figure out what points you need to trace the outline of the shape, so the fill color of the shape provides the color of the shape. Your data had been generated so that one colored pixel at each point provides the color of the shape.


How can I rearrange the coordinates using vba?


Or how can I loop through the graph points without changing the coordinates?
I can not know the correct order of values in the cells (there are many) to do this manually.


My algorithm for scanning the pixels of the image I've corrected and the same problem continues because the image is scanned horizontally and not by areas of contiguous color.


Each line of the graph is formed by 3 or more contiguous points and not just a single point because the line is scanned point by point.


Please look at the previous questions from my previous posts.

thanks!
 
Upvote 0
The scanning technique is fine for coloring discrete pixels, but it is incompatible with the approach that creates shapes using plotted points as the shape outlines. It is not a matter of scanning the rasterized points you have in a different order, because the rasterized points are not the points you need for the shape outlines. VBA is magic, but it can't help turn the wrong points into the right points.


Yes,Jhon, i understand you.
But i am want any advancement in this technique and not just a perfect result at this moment, not just a perfect outline, but any advance in that direction of my goal.

I do not necessarily need an empty outline contour, it may be a solid solid line, they may be parts (multiple or partial shapes) of the drawing and not necessarily the entire drawing.


I've already glimpsed some possibilities, but they are all still more laborious and I still can not start, but I will start the tests soon.


What you told me about having only main colored dots is a good idea, I could do this in the original drawing or the chart, but I still want to try something more exact and automatic, to be able to scan an image and it turns a chart (and shape) directly The way I need it.

I'm thinking of studying "nodes.parent", "Previous and Next PointNode",


If I can also get a VBA routine to Indentify and delete the correct Points from the chart this can also help me !! ???
Can you tell me how I can get the most important PointNodes (VERTICES) of the chart (which can serve as a reference)?

Any code like this can help me
See in the thread below that another user needs something similar at the same moment.


thank you, Master!

https://www.mrexcel.com/forum/excel...g-specific-data-scatter-plot.html#post4786230
"https://www.mrexcel.com/forum/excel-questions/997386-selecting-specific-data-scatter-plot.html#post4786230"
 
Last edited:
Upvote 0

Forum statistics

Threads
1,214,636
Messages
6,120,666
Members
448,977
Latest member
moonlight6

We've detected that you are using an adblocker.

We have a great community of people providing Excel help here, but the hosting costs are enormous. You can help keep this site running by allowing ads on MrExcel.com.
Allow Ads at MrExcel

Which adblocker are you using?

Disable AdBlock

Follow these easy steps to disable AdBlock

1)Click on the icon in the browser’s toolbar.
2)Click on the icon in the browser’s toolbar.
2)Click on the "Pause on this site" option.
Go back

Disable AdBlock Plus

Follow these easy steps to disable AdBlock Plus

1)Click on the icon in the browser’s toolbar.
2)Click on the toggle to disable it for "mrexcel.com".
Go back

Disable uBlock Origin

Follow these easy steps to disable uBlock Origin

1)Click on the icon in the browser’s toolbar.
2)Click on the "Power" button.
3)Click on the "Refresh" button.
Go back

Disable uBlock

Follow these easy steps to disable uBlock

1)Click on the icon in the browser’s toolbar.
2)Click on the "Power" button.
3)Click on the "Refresh" button.
Go back
Back
Top